Hours worked and labour productivity in the provinces and territories
Archived Content
Information identified as archived is provided for reference, research or recordkeeping purposes. It is not subject to the Government of Canada Web Standards and has not been altered or updated since it was archived. Please "contact us" to request a format other than those available.
Related subjects
-
[an error occurred while processing this directive]
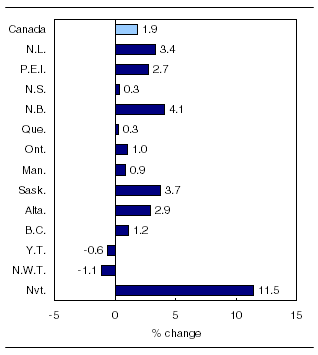
Labour productivity in the business sector increased in every province and in Nunavut in 2010.
Labour productivity in the business sector by province and territory, 2010

Chart description: Labour productivity in the business sector by province and territory, 2010
After declining by more than 4.0% in 2009, the real gross domestic product (GDP) of Canadian businesses and hours worked both rebounded in 2010, with the real GDP (+3.7%) growing almost twice as fast as hours worked (+1.9%).
Real GDP of goods-producing businesses (+5.4%) increased faster than the real GDP of services-producing businesses (+2.4%) in 2010, mostly as a result of increased activity in manufacturing, construction as well as in mining and oil and gas extraction.
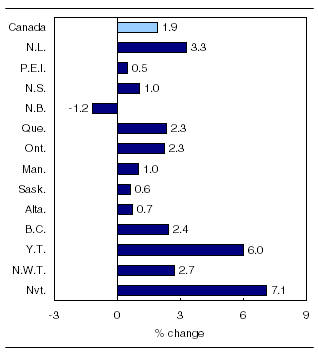
Hours worked in businesses rose in every province and territory except New Brunswick (-1.2%).
Every province except Quebec and Manitoba posted a higher rate of productivity growth in 2010 than in 2009. At the national level, business productivity rose 1.9% in 2010 after declining by 0.3% in 2009.
New Brunswick (+4.1%) posted the largest increase in business productivity among the provinces in 2010. Manufacturing, forestry, wholesale and retail trade were the main contributors to this productivity boost.
The provinces with resource-based economies (Alberta, Saskatchewan and Newfoundland and Labrador) posted productivity gains above the national average. This was in sharp contrast with 2009, when these three provinces were among those experiencing the sharpest declines in productivity. Prince Edward Island also saw above-average productivity growth.
Note to readers
This release covers provincial and territorial data on labour productivity and related variables by business-sector industry. It constitutes a revision for 1997 to 2010 of the estimates released on May 19, 2011. The revisions bring the data into line with the revised data for the "Provincial and territorial economic accounts" published on November 8, 2011 and the revisions of the Labour Force Survey estimates published on January 28, 2011.
Labour productivity is a measure of real gross domestic product per hour worked. Productivity gains occur when the production of goods and services grows faster than the volume of work dedicated to their production.
Economic performance, as measured by labour productivity, must be interpreted carefully, as these data reflect changes in other inputs, in particular capital, in addition to the efficiency growth of production processes. As well, growth in labour productivity is often influenced by the degree of diversity in the industrial structure. As a result, labour productivity tends to be more volatile in the smaller provinces.
For the purpose of this analysis, as in the national labour productivity releases, productivity measures cover the business sector. It is important to note that real production is based on value added measured at basic prices, not market prices, which is consistent with the detailed framework by industry.
As well, the service-producing business sector and its component, finance, insurance and real estate, exclude the imputed rent for owner-occupied dwellings, because there are no data on the number of hours that homeowners spend on dwelling maintenance services.
Nunavut (+11.5%) posted the largest increase in productivity among the territories, as a result of the opening of a new gold mine. Meanwhile, Yukon and the Northwest Territories were the only regions in Canada that experienced a decrease in productivity.
Average hourly compensation among Canadian businesses rose 2.1% in 2010, following a 2.0% gain the previous year. Ontario and British Columbia were the only provinces that had an increase below the national average.
Atlantic provinces
Productivity increased by 3.4% in Newfoundland and Labrador, following a 5.5% decline in 2009. This was the largest increase in real GDP of businesses and hours worked among the provinces in 2010. The real GDP of businesses advanced 6.8% as a result of increased business investment, while hours worked rose 3.3%.
In Prince Edward Island, business productivity rose 2.7% in 2010, following a 1.2% gain a year earlier. The increase in productivity in 2010 was attributable to a much larger advance in output than in hours worked (3.4% versus 0.5%). Residential construction and retail trade were the main industries responsible for the advance in the real GDP of businesses.
In Nova Scotia, business productivity was up 0.3% in 2010, the same rate of increase as in 2009. Nova Scotia was the lone Atlantic province that had an increase below the national average. Hours worked rose 1.0%, while the real GDP of businesses increased 1.4%, led by manufacturing.
The upswing in productivity in New Brunswick in 2010 followed a 0.7% decline in 2009. The increase in 2010 was attributable to a continued reduction in hours worked, combined with higher business output. Most of the growth in the real GDP of businesses came from manufacturing, forestry and mining. Hours worked (-1.2%) fell at the same pace as in 2009. New Brunswick was the only province where businesses cut back on hours worked in 2010.
Hours worked in the business sector by province and territory, 2010

Chart description: Hours worked in the business sector by province and territory, 2010
Central Canada
In Quebec, business productivity increased 0.3% in 2010, following a 1.7% advance in 2009. Overall, lower productivity in services-producing businesses slowed productivity growth in the business sector as a whole. In goods-producing businesses, productivity was up 1.9%. The advance was widespread, with utilities posting the largest increase.
The real GDP of Quebec businesses grew 2.6% in 2010, led by residential construction and manufacturing. At the same time, hours worked rose by 2.3%, with gains in every industry except utilities. For Quebec's manufacturers, productivity was up for the eighth consecutive year (+0.4% in 2010).
In Ontario, business productivity increased 1.0% in 2010, after remaining unchanged the previous year. Manufacturing and construction were responsible for the 2010 increase in productivity. The upswing in the manufacturing sector, especially the motor vehicle and parts industry, was a major factor in the upturn in business output.
After two years of declines, manufacturing productivity in Ontario rebounded with a 4.6% gain in 2010. Manufacturing output rose 6.3%, following two years of sharp declines. At the same time, hours worked rose by 1.6%, after five consecutive annual decreases. In 2009, manufacturing output and hours worked both fell by more than 10%.
Western provinces
Business productivity rose by 0.9% in Manitoba in 2010, following a 1.2% advance in 2009. Hours worked were up 1.0%, less than half the growth rate in real GDP (+2.1%). Construction, wholesale and retail trade as well as transportation services were the main contributors to output growth.
In Saskatchewan, business productivity rose 3.7% in 2010, following a 3.6% decline in 2009. Hours worked edged up 0.6% in 2010, while the real GDP of businesses rose 4.5%, mainly as a result of strength in the mining sector.
Business productivity in Alberta grew 2.9% in 2010, following three consecutive annual declines. The largest contributors to the increase in productivity were manufacturing, wholesale trade, transportation and warehousing as well as finance. The real GDP of businesses grew 3.7%, led by increases in mining and oil and gas extraction support activities, manufacturing and crop production. Hours worked in the business sector rose 0.7%, with the largest gains in mining and oil and gas extraction and construction.
In British Columbia, business productivity grew 1.2% in 2010, following a 0.9% increase in 2009. However, productivity gains in 2010 reflected a 3.5% advance in business output combined with a 2.4% increase in hours worked, whereas both output and hours worked declined in 2009. Real GDP growth was primarily a result of manufacturing, forestry, construction as well as support activities for mining and oil and gas extraction. Forestry, mining and retail trade were the industries mainly responsible for the increase in hours worked.
The territories
In Yukon, business productivity fell 0.6% in 2010, following a 7.6% gain in 2009. A decline in total mining output slowed the increase in the real GDP of businesses. Meanwhile, the increase in hours worked accelerated in both the goods and service producing industries.
In the Northwest Territories, business productivity was down again in 2010 (-1.1%), though the decrease was much smaller than in 2009 (-8.3%). Real output advanced 1.5%, partly as a result of increased construction and mining activity. Hours worked also rebounded (+2.7%), following a sharp decline in 2009.
Business productivity in Nunavut rose 11.5% in 2010, the strongest growth rate in Canada. In contrast, the territory experienced the largest decrease in 2009 (-11.2%). Output and hours worked rose sharply in 2010, mainly as a result of the opening of a new gold mine and the associated activities.
Available on CANSIM: tables 383-0009 to 383-0011.
Definitions, data sources and methods: survey number 5103.
For more information, or to enquire about the concepts, methods or data quality of this release, contact the information officer (613-951-3640; iead-info-dcrd@statcan.gc.ca), Income and Expenditure Accounts Division.
- Date modified:
