
Insights on Canadian Society
Religiosity in Canada and its evolution from 1985 to 2019
by Louis Cornelissen

Text begins
Start of text box
Overview of the study
In recent decades, the religious landscape in Canada has undergone significant changes, including a decline in religious affiliation and the practice of religious activities, both collectively and individually. Data from several cycles of the General Social Survey were used in this study to paint a portrait of the diverse relationships Canadians have with religion. The study also presents key trends in the evolution of religiosity in Canada since 1985.
- In 2019, 68% of Canadians aged 15 and older reported having a religious affiliation. In addition, just over half of Canadians (54%) said they considered their religious or spiritual beliefs to be somewhat or very important to how they live their lives. Participation in group or individual religious activities was less common: 23% of Canadians said they participated in a group religious activity at least once a month, and 30% said they engaged in a religious or spiritual activity on their own at least once a week.
- Overall, reporting a religious affiliation is not necessarily related to placing a high importance on religion in everyday life. In fact, during 2017 to 2019, nearly one in five Canadians (18%) reported having a religious affiliation while indicating that they rarely or never participated in group religious activities, never engaged in religious or spiritual activities on their own, and considered their religious or spiritual beliefs to be of little or no importance to how they live their lives.
- In recent decades, there has been a decline in religious affiliation, participation in group or individual religious or spiritual activities, and the importance of religious and spiritual beliefs in how people live their lives. Changes in indicators of religiosity over time appear to be the result of differences between younger and older cohorts.
- Compared with individuals born in Canada, those born outside Canada were more likely to report having a religious affiliation, to consider their religious and spiritual beliefs important to how they live their lives, and to engage in religious activities in groups or on their own. These differences were more pronounced among younger birth cohorts.
- There were some differences in religiosity across the country. For example, in British Columbia, religious non-affiliation was more common and generational differences in religious practice were smaller. In Quebec, religious affiliation was higher, but was more often combined with lower importance given to religious or spiritual beliefs. Religious practice was also generally lower in Quebec. Lastly, in the Atlantic provinces, the generational differences were larger than elsewhere in the country.
Introduction
Historically, Canada has been characterized by its religious diversity.Note This religious diversity is closely linked to the diversity of Canadians’ origins and cultural differences across the country. Understanding the changes in Canada’s religious landscape allows for a better understanding of the country’s cultural and social history, and the diversity of its current population. From a sociological standpoint, the study of the evolution of religion allows for a better understanding of some of the changes modern societies are facing.Note In addition, religion is important with respect to population change because it can influence important demographic factors such as marriage, divorce and fertility.Note
The Census of Population has therefore included a question on the religious affiliation of Canadians every 10 years since 1871. In recent decades, the censuses have tracked changes in Canadians’ religiosity, including an increase in the proportion of people who report having no religious affiliation, and an increase in the proportion of those reporting a non-Christian religious affiliation.Note New statistical information from the 2021 Census will soon provide an updated picture of religious diversity in Canada. Among other things, this information will provide a more detailed picture of religious affiliations in Canada and the people who report these affiliations.
However, religious diversity is not limited to religious affiliation: there are also many different ways to experience religion individually, that is, there are a variety of practices, beliefs and roles that religion or spirituality plays in the lives of individuals.Note This diversity in how people live their religion is largely independent of religious affiliation. Therefore, several aspects of the relationship of individuals to religion need to be looked at simultaneously to provide an overview of religion in Canada and how it has changed in recent decades. A better understanding of the diversity and evolution of religious practices and beliefs in Canadian society can help foster inclusion and social cohesion in Canada.
This study examines various aspects of Canadians’ religiosity by analyzing a series of indicators from several cycles of the General Social Survey (GSS) from 1985 to 2019 (see “Definitions, data sources and methods”). Specifically, the study examines changes in the following four indicators:
- religious affiliation (1985 to 2019)
- frequency of participation in group religious activities, excluding special occasions such as weddings or funerals (1985 to 2019)
- frequency of engaging in religious or spiritual activities on one’s own (e.g., prayer, meditation, or other forms of devotion at home or elsewhere) (2006 to 2019)
- the importance of religious or spiritual beliefs in how one lives one’s life (2003 to 2019).
The study focuses on the population aged 15 and older residing in the Canadian provinces.Note First, it examines the recent situation, using combined data, from 2017 to 2019. Then it explores the evolution of the four religiosity indicators over time, with a particular emphasis on the differences based on the year of birth. Lastly, the differences between birth cohorts by place of birth and region of residence are examined.
For the purposes of this study, the term “religiosity” refers to all the different forms of individual relationships to religion that can be identified by the questions asked in the GSS. This study will not attempt to quantify the notion of religiosity or to rank the different forms of religiosity. For example, it will avoid saying that people who participate in group religious activities more frequently are “more religious” or have “higher religiosity.” Instead, it will describe different religiosities, that is, different ways in which individuals relate to religion.
Around two-thirds of Canadians reported having a religious affiliation
In 2019, just over two-thirds (68%) of the Canadian population reported having a religious affiliation,Note and over half (54%) said their religious or spiritual beliefs were somewhat or very important to how they live their lives (Table 1). Additionally, about one-quarter (23%) of Canadians had participated in a group religious activity at least once a month in the year prior to the survey (including attending religious meetings or services, but excluding special occasions such as weddings or funerals). Lastly, more than one-third (37%) had engaged in religious or spiritual activities on their own at least once a month during the same year (e.g., prayer, meditation, or other forms of devotion at home or elsewhere).
Women were more likely than men to report having a religious affiliation (72% versus 64%) or to consider their religious or spiritual beliefs to be somewhat or very important to how they live their lives (61% versus 47%). In addition, women were more likely than men to engage in group religious activities and, especially, religious or spiritual activities on their own (36% of women engaged in such an activity at least once a week, compared with 24% of men). The same type of results are found by gender and age. Women are more likely than men to report a religious affiliation, to participate in group or individual religious or spiritual activities, and to place a high value on their religious or spiritual beliefs, regardless of age (data not presented). These gender differences in religiosity have been studied elsewhere, but there is no consensus on the reasons behind them.Note
| Indicator of religiosity | Total | Gender | |
|---|---|---|---|
| Male (ref.) | Female | ||
| percentage | |||
| Religious affiliation | |||
| Yes | 68 | 64 | 72Note * |
| No | 32 | 36 | 28Note * |
| Frequency of participation in group religious activities | |||
| At least once a week | 16 | 14 | 18Note * |
| At least once a month | 7 | 7 | 8 |
| At least once a year | 24 | 24 | 25 |
| Not at all | 53 | 55 | 50Note * |
| Frequency of engaging in religious or spiritual activities on one's own | |||
| At least once a day | 20 | 15 | 24Note * |
| At least once a week | 10 | 9 | 12Note * |
| At least once a month | 7 | 6 | 7 |
| At least three times a year | 4 | 4 | 4 |
| Once or twice a year | 7 | 6 | 7 |
| Not at all | 53 | 60 | 46Note * |
| Importance of religious or spiritual beliefs in how to live one’s life | |||
| Very important | 29 | 25 | 33Note * |
| Somewhat important | 25 | 22 | 28Note * |
| Not very important | 17 | 18 | 16 |
| Not important at all | 29 | 35 | 23Note * |
|
|||
Combining indicators reveals different religiosity profiles
The different religiosity indicators are partly independent of each other. For example, a person may report a religious affiliation but place little or no importance on their religious or spiritual beliefs. Conversely, a person may consider such beliefs very important while reporting having no religious affiliation.
Instead of each of the indicators being examined in isolation, they can be combined to reveal several religiosity profiles. This underscores the complexity and multidimensional nature of the ways individuals relate to religion.
Table 2 presents some combinations of the four religiosity indicators. To have a larger sample and better quality estimates, the data for 2017 to 2019 were combined (see “Definitions, data sources and methods”). These crossings enable a set of religiosity profiles to be identified, with some comprising a significantly higher percentage of the total population than others.
| Participation in a group religious activity | Total | |||||||
|---|---|---|---|---|---|---|---|---|
| At least once a month | Less than once a month or never | |||||||
| Individual religious or spiritual practice | ||||||||
| At least once a week | At least once a yearTable 2 Note 1 | Never | At least once a week | At least once a yearTable 2 Note 1 | Never | |||
| percentage | ||||||||
| Religious affiliation | Beliefs: somewhat important or very important | 18.8 | 2.9 | 1.5 | 11.8 | 8.3 | 8.6 | 51.9 |
| Beliefs: not very important or not important at all | 0.2Table 2 Note N | 0.3 | 0.3 | 0.9 | 4.0 | 17.6 | 23.2 | |
| No religious affiliation | Beliefs: somewhat important or very important | 0.1Table 2 Note N | 0.1Table 2 Note N | 0.1Table 2 Note N | 1.4 | 0.9 | 2.6 | 5.2 |
| Beliefs: not very important or not important at all | 0.0Table 2 Note N | 0.0Table 2 Note N | 0.1Table 2 Note N | 0.3 | 1.1 | 18.1 | 19.7 | |
| Total | 19.1 | 3.3 | 2.0 | 14.5 | 14.3 | 46.9 | 100.0 | |
Source: Statistics Canada, General Social Survey, cycles 31, 32 and 34, 2017 to 2019. |
||||||||
Most people who participated in a group religious activity at least once a month reported having a religious affiliation and placed high importance on their beliefs
From 2017 to 2019, nearly one in four Canadians (24%) participated in a group religious activity at least once a month. The vast majority of them also reported having a religious affiliation, frequent engagement in religious or spiritual activities on their own, and considered their religious or spiritual beliefs to be somewhat or very important to how they live their lives. Almost one in five people, or 19% of the Canadian population, had this religiosity profile from 2017 to 2019 (Table 2). This was the largest group among all religiosity profiles.
Compared with people who participated in group religious activities at least once a month, those who participated less frequently had much more diverse religiosity profiles. Among them, the largest group included those who at the same time were relatively less religiously active (group religious activities less than once a month and no religious practices on their own), reported having no religious affiliation, and considered their religious or spiritual beliefs to be of little or no importance in terms of how they live their lives. These unaffiliated, non-practising people who placed little importance on religious or spiritual beliefs represented almost one in five Canadians, or 18% of the total population.
Still among those who participated in group religious activities less than once a month or never, the third-largest group was made up of people who, while never practising religious activities on their own and placing little or no importance on religious or spiritual beliefs in their lives, still reported having a religious affiliation (18% of the total population). This group likely includes a large proportion of those who have been described by some as “nominally affiliated” (or “fuzzy” religious)Note — that is, people for whom religious practices and beliefs are a marginal part of daily life, but who still maintain an identification with a religion.
Several other religiosity profiles, presented in Table 2, deserve particular attention even if they represent proportionally fewer Canadians. These profiles are highlighted by taking into account the importance given to beliefs and individual religious or spiritual practices, in addition to the traditional indicators of religious affiliation and group religious practices.
This is the case for 12% of Canadians, who, while rarely or never participating in group religious activities, had a positive relationship with religion: these individuals were affiliated with a religion, considered their religious or spiritual beliefs to be somewhat or very important, and engaged in religious or spiritual activities on their own at least once a week.
In summary, combining different religiosity indicators reveals important nuances that are sometimes missing from research on religiosity in Canada.
In the remainder of this article, some results will be presented for those with and without a religious affiliation and according to the importance given to religious and spiritual beliefs in one’s lifestyle (rows in Table 2). The remainder combines the frequency of participation in group religious activities with the frequency of engaging in religious or spiritual activities on one’s own (simplified version of the columns in Table 2).
Regardless of religious affiliation, most individuals reported that religious or spiritual beliefs were important in their lives
The prevalence of certain forms of religiosity varied by self-reported religious affiliation (Table 3). First, there were significant differences with regard to participation in religious activities. Among all Canadians who reported having a religious affiliation, just under one third (32%) participated in group religious activities at least once a month. However, some groups of affiliations had proportions well above this average—Jehovah’s Witnesses (86%), Latter Day Saints (80%), Anabaptists (75%), and Pentecostals or other Charismatics (72%). Others had proportions below the average—Buddhists (15%), Anglicans (19%), United Church (19%) and Jews (24%).
This variation may be the result of differences in the makeup of the populations reporting various affiliations, or of denominational differences in the forms of religious practices. In addition, the question regarding frequency of participation in group religious activities asks respondents to exclude special events (such as weddings, funerals, baptisms, or bar or bat mitzvahs). These uncounted rites of passage may vary in importance across affiliations.
Despite some variation in the importance of religious beliefs by affiliation, the majority of people from each religious affiliation reported that their religious or spiritual beliefs were somewhat or very important to the way they live their lives (from 62% for Catholics to 98% for Jehovah’s Witnesses).
| Religion of affiliation (aggregated) | Share of total population | Frequency of participation in group religious activities and individual religious or spiritual activities | Importance of religious or spiritual beliefs in how to live one’s lifeTable 3 Note 1 | ||||
|---|---|---|---|---|---|---|---|
| In groups at least once a month | In groups less than once a month, but individually at least once a week | In groups or individually at least once during the year (not included elsewhere) | No group participation or individual religious practices | Somewhat important or very important | Not very important or not important at all | ||
| percentage | |||||||
| Buddhist | 1.4 | 15 | 17 | 45 | 23 | 67 | 33 |
| Christian (total) | 63.2 | 31 | 16 | 24 | 29 | 68 | 32 |
| Christian (no other specification) | 10.3 | 44 | 15 | 20 | 20 | 77 | 23 |
| Anabaptist | 0.5 | 75 | 10Table 3 Note N | 8Table 3 Note N | 6Table 3 Note N | 93 | 7Table 3 Note N |
| Anglican | 3.8 | 19 | 17 | 26 | 39 | 62 | 38 |
| Baptist | 1.4 | 54 | 12 | 15 | 19 | 86 | 14 |
| Catholic | 32.0 | 25 | 17 | 27 | 31 | 62 | 38 |
| Christian Orthodox | 1.4 | 26 | 19 | 34 | 21 | 73 | 27 |
| Jehovah’s Witness | 0.4 | 86 | 5Table 3 Note N | 5Table 3 Note N | 4Table 3 Note N | 98 | 2Table 3 Note N |
| Latter Day Saints | 0.3 | 80 | 7Table 3 Note N | 7Table 3 Note N | 6Table 3 Note N | 96 | 4Table 3 Note N |
| Lutheran | 1.2 | 31 | 15 | 26 | 28 | 66 | 34 |
| Methodist and Wesleyan (Holiness) | 0.3 | 46 | 12Table 3 Note N | 19 | 23 | 87 | 13Table 3 Note N |
| Pentecostal and other Charismatic religions | 0.8 | 72 | 9Table 3 Note N | 8Table 3 Note N | 12Table 3 Note N | 94 | 6Table 3 Note N |
| Reformed and Presbyterian | 1.4 | 35 | 12 | 20 | 33 | 69 | 31 |
| United Church | 3.8 | 19 | 15 | 26 | 39 | 64 | 36 |
| Other Christian and Christian-related traditions | 4.4 | 35 | 17 | 18 | 31 | 73 | 27 |
| Hindu | 1.7 | 31 | 23 | 34 | 12Table 3 Note N | 79 | 21 |
| Jewish | 1.0 | 24 | 9 | 49 | 18 | 70 | 30 |
| Muslim | 3.7 | 42 | 23 | 15 | 19 | 82 | 18 |
| Sikh | 1.4 | 48 | 12Table 3 Note N | 36 | 4Table 3 Note N | 84Table 3 Note N | 16 |
| Traditional (North American Indigenous) spirituality | 0.2 | 22Table 3 Note N | 34Table 3 Note N | 15Table 3 Note N | 29Table 3 Note N | 83 | 17Table 3 Note N |
| Other religions and spiritual traditions | 1.0 | 24 | 30 | 25 | 20 | 79 | 21 |
| Total (people who reported a religious affiliation) | 73.7 | 32 | 16 | 25 | 27 | 69 | 30 |
| No religion and secular perspectives | 26.3 | 2 | 7 | 17 | 74 | 21 | 79 |
Source: Statistics Canada, General Social Survey, cycles 31 to 34, 2017 to 2019. |
|||||||
Religious affiliation, religious activities and importance given to religious beliefs have each been in decline for decades
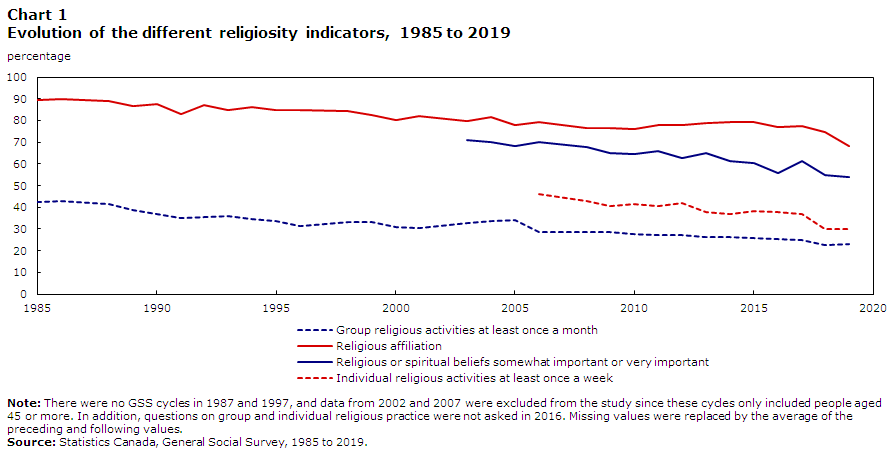
Over the time periods covered by each of the indicators, religious affiliation, the frequency of participation in group religious activities, the frequency of engaging in religious or spiritual activities on one’s own, and the importance placed on religious and spiritual beliefs in one’s life have all tended to decline (Chart 1).
For example, in 1985, 90% of people aged 15 and older reported having a religious affiliation, compared with 68% in 2019. Meanwhile, the proportion of people who attended group religious activities at least once a month nearly halved, from 43% in 1985 to 23% in 2019. Moreover, 71% of people reported in 2003 that their religious or spiritual beliefs were somewhat or very important, compared with 54% in 2019. Lastly, the proportion of people who engaged in religious or spiritual activities on their own at least once a week also declined, from 46% in 2006 to 30% in 2019.
Data table for Chart 1
| Year | Group religious activities at least once a month | Religious affiliation | Religious or spiritual beliefs somewhat important or very important | Individual religious activities at least once a week |
|---|---|---|---|---|
| percentage | ||||
| 1985 | 42.5 | 89.5 | Note ...: not applicable | Note ...: not applicable |
| 1986 | 42.8 | 89.7 | Note ...: not applicable | Note ...: not applicable |
| 1988 | 41.4 | 89.0 | Note ...: not applicable | Note ...: not applicable |
| 1989 | 38.7 | 86.6 | Note ...: not applicable | Note ...: not applicable |
| 1990 | 36.9 | 87.7 | Note ...: not applicable | Note ...: not applicable |
| 1991 | 35.0 | 83.2 | Note ...: not applicable | Note ...: not applicable |
| 1992 | 35.6 | 86.9 | Note ...: not applicable | Note ...: not applicable |
| 1993 | 36.2 | 84.8 | Note ...: not applicable | Note ...: not applicable |
| 1994 | 34.8 | 86.1 | Note ...: not applicable | Note ...: not applicable |
| 1995 | 33.5 | 84.7 | Note ...: not applicable | Note ...: not applicable |
| 1996 | 31.2 | 84.9 | Note ...: not applicable | Note ...: not applicable |
| 1998 | 33.1 | 84.2 | Note ...: not applicable | Note ...: not applicable |
| 1999 | 33.1 | 82.7 | Note ...: not applicable | Note ...: not applicable |
| 2000 | 31.1 | 80.4 | Note ...: not applicable | Note ...: not applicable |
| 2001 | 30.5 | 82.1 | Note ...: not applicable | Note ...: not applicable |
| 2003 | 32.6 | 79.9 | 71.0 | Note ...: not applicable |
| 2004 | 33.8 | 81.6 | 70.1 | Note ...: not applicable |
| 2005 | 34.2 | 78.0 | 68.3 | Note ...: not applicable |
| 2006 | 28.7 | 79.3 | 70.0 | 46.0 |
| 2008 | 28.5 | 76.6 | 67.7 | 42.8 |
| 2009 | 28.5 | 76.3 | 65.2 | 40.7 |
| 2010 | 27.9 | 76.2 | 64.7 | 41.4 |
| 2011 | 27.3 | 78.1 | 66.0 | 40.4 |
| 2012 | 27.4 | 77.7 | 62.9 | 42.0 |
| 2013 | 26.2 | 78.7 | 64.9 | 37.8 |
| 2014 | 26.2 | 79.4 | 61.5 | 37.1 |
| 2015 | 26.0 | 79.3 | 60.3 | 38.2 |
| 2016 | 25.5 | 76.9 | 55.8 | 37.6 |
| 2017 | 24.9 | 77.6 | 61.2 | 37.1 |
| 2018 | 22.8 | 74.6 | 54.9 | 30.2 |
| 2019 | 23.3 | 68.3 | 54.1 | 30.0 |
|
... not applicable Note: There were no GSS cycles in 1987 and 1997, and data from 2002 and 2007 were excluded from the study since these cycles only included people aged 45 or more. In addition, questions on group and individual religious practice were not asked in 2016. Missing values were replaced by the average of the preceding and following values. Source: Statistics Canada, General Social Survey, 1985 to 2019. |
||||
Changes in religiosity indicators are partly due to differences in religiosity between younger and older generations
How should changes over time in religiosity indicators be interpreted? Does individuals’ relationship with religion evolve over their adult lives, or are those changes due to a succession of generations characterized by different forms of religiosity?
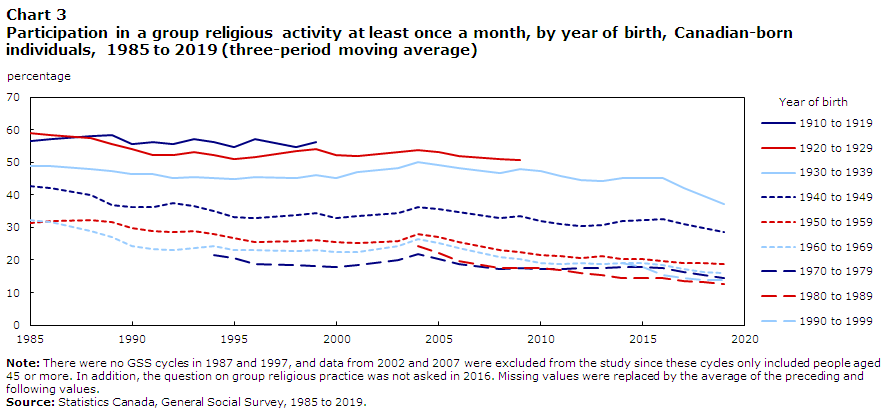
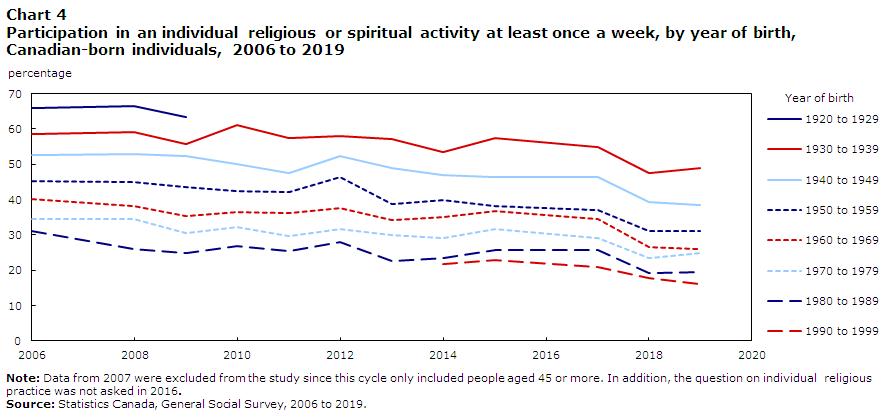
Charts 2 to 5 present the changes in the different religiosity indicators, by year of birth cohort, for Canadian-born individuals.Note In general, the younger the cohort, the lower the proportion of those who reported having a religious affiliation (Chart 2), the less frequent the participation in group religious activities (Chart 3), the less frequent the individual religious or spiritual activities (see Chart 4 in the appendix), and the less importance given to religious and spiritual beliefs in how one lives one’s life (see Chart 5 in the appendix).
In each case, the situation tends to be relatively stable within a cohort, although there are some age-related changes. The replacement of older cohorts with newer cohorts thus appears to be the main driver of changes in religiosity over time. In other words, the decline in religious affiliation, participation in religious activities, and the importance placed on religious or spiritual beliefs is primarily explained by recent (younger) generations having a different relationship to religion than older ones, not by a change over time in that relationship within each generation.
The importance of cohort effects in the evolution of religiosity has been found in other studies, both in Canada and elsewhere.Note These studies suggest that the socialization of children and youth has a relatively lasting impact on their religious identities, practices and beliefs, and that the changes in religiosity observed in the population may be reflecting changes at this level.Note Thiessen and Wilkins-Laflamme, for example, found that, among a set of Western countries, members of more recent cohorts tended to have been raised without religion and, regardless of whether they were raised with or without religion, were increasingly likely to report having no religious affiliation.Note
That said, people’s religiosity may also change over the course of their lives, and this is reflected in the changes over time in the religiosity indicators within each of the cohorts. In virtually all cohorts, the frequency of group and individual religious activities and the importance placed on religious and spiritual beliefs in one’s life tended to decline with age.
In contrast, the situation within cohorts has been more stable with respect to religious affiliation, despite some fluctuations. Within most cohorts, the proportion of people who reported having a religious affiliation tended to decline slightly over time until 2010, and then the trend reversed. Thus, while there is a clear decline over time in practices and in the importance given to religious and spiritual beliefs within each cohort, these changes do not necessarily translate into complete religious disaffiliation, especially at older ages. Lifetime religious disaffiliation appeared to be somewhat more common among the youngest age group (15 to 30 years). For those who do not report having a religious affiliation, but come from a religious family background, it is often in late adolescence and early adulthood that this transition in religious identification or non-identification takes place.Note

Data table for Chart 2
| Year | Year of birth | ||||||||
|---|---|---|---|---|---|---|---|---|---|
| 1910 to 1919 | 1920 to 1929 | 1930 to 1939 | 1940 to 1949 | 1950 to 1959 | 1960 to 1969 | 1970 to 1979 | 1980 to 1989 | 1990 to 1999 | |
| percentage | |||||||||
| 1985 | 96.6 | 95.9 | 93.7 | 90.8 | 85.6 | 86.3 | Note ...: not applicable | Note ...: not applicable | Note ...: not applicable |
| 1986 | 96.8 | 95.6 | 94.0 | 91.1 | 85.5 | 86.1 | Note ...: not applicable | Note ...: not applicable | Note ...: not applicable |
| 1988 | 96.1 | 94.7 | 93.3 | 91.1 | 85.0 | 84.7 | Note ...: not applicable | Note ...: not applicable | Note ...: not applicable |
| 1989 | 95.9 | 94.5 | 93.1 | 91.0 | 85.2 | 84.4 | Note ...: not applicable | Note ...: not applicable | Note ...: not applicable |
| 1990 | 95.0 | 93.7 | 91.9 | 88.9 | 84.1 | 82.3 | Note ...: not applicable | Note ...: not applicable | Note ...: not applicable |
| 1991 | 95.4 | 93.6 | 92.8 | 88.2 | 85.3 | 82.8 | Note ...: not applicable | Note ...: not applicable | Note ...: not applicable |
| 1992 | 95.0 | 93.2 | 92.8 | 87.8 | 84.2 | 80.9 | Note ...: not applicable | Note ...: not applicable | Note ...: not applicable |
| 1993 | 94.9 | 93.9 | 93.1 | 89.8 | 85.3 | 81.8 | Note ...: not applicable | Note ...: not applicable | Note ...: not applicable |
| 1994 | 94.1 | 93.2 | 92.8 | 90.4 | 84.2 | 81.0 | 77.5 | Note ...: not applicable | Note ...: not applicable |
| 1995 | 93.7 | 93.4 | 92.8 | 90.1 | 85.3 | 81.9 | 77.5 | Note ...: not applicable | Note ...: not applicable |
| 1996 | 94.9 | 92.9 | 93.3 | 89.7 | 85.4 | 82.2 | 76.4 | Note ...: not applicable | Note ...: not applicable |
| 1998 | 95.3 | 93.7 | 93.1 | 89.0 | 85.5 | 82.0 | 75.5 | Note ...: not applicable | Note ...: not applicable |
| 1999 | 96.1 | 92.4 | 92.1 | 88.5 | 84.4 | 80.6 | 74.0 | Note ...: not applicable | Note ...: not applicable |
| 2000 | Note ...: not applicable | 92.3 | 91.8 | 87.7 | 84.3 | 80.3 | 72.9 | Note ...: not applicable | Note ...: not applicable |
| 2001 | Note ...: not applicable | 91.2 | 91.6 | 87.6 | 83.1 | 80.1 | 72.6 | Note ...: not applicable | Note ...: not applicable |
| 2003 | Note ...: not applicable | 92.5 | 92.1 | 88.2 | 84.3 | 81.3 | 72.3 | Note ...: not applicable | Note ...: not applicable |
| 2004 | Note ...: not applicable | 91.3 | 91.1 | 88.2 | 83.8 | 80.6 | 71.7 | 68.0 | Note ...: not applicable |
| 2005 | Note ...: not applicable | 92.1 | 90.9 | 88.4 | 84.2 | 80.3 | 71.4 | 67.7 | Note ...: not applicable |
| 2006 | Note ...: not applicable | 91.3 | 90.4 | 87.8 | 82.5 | 79.1 | 69.8 | 66.0 | Note ...: not applicable |
| 2008 | Note ...: not applicable | 92.0 | 91.3 | 87.5 | 81.8 | 78.2 | 69.3 | 64.4 | Note ...: not applicable |
| 2009 | Note ...: not applicable | 91.8 | 91.5 | 86.9 | 81.2 | 77.8 | 67.6 | 62.5 | Note ...: not applicable |
| 2010 | Note ...: not applicable | Note ...: not applicable | 92.2 | 86.6 | 82.1 | 78.2 | 68.7 | 63.1 | Note ...: not applicable |
| 2011 | Note ...: not applicable | Note ...: not applicable | 92.1 | 86.8 | 82.4 | 79.4 | 69.4 | 64.3 | Note ...: not applicable |
| 2012 | Note ...: not applicable | Note ...: not applicable | 92.3 | 87.8 | 84.2 | 81.1 | 72.1 | 65.2 | Note ...: not applicable |
| 2013 | Note ...: not applicable | Note ...: not applicable | 92.9 | 89.6 | 85.1 | 82.4 | 73.3 | 64.5 | Note ...: not applicable |
| 2014 | Note ...: not applicable | Note ...: not applicable | 93.3 | 90.3 | 86.2 | 83.4 | 75.4 | 64.0 | 66.7 |
| 2015 | Note ...: not applicable | Note ...: not applicable | 93.5 | 90.5 | 85.8 | 83.0 | 74.8 | 64.0 | 66.0 |
| 2016 | Note ...: not applicable | Note ...: not applicable | 93.0 | 90.2 | 85.5 | 82.6 | 74.6 | 64.3 | 64.0 |
| 2017 | Note ...: not applicable | Note ...: not applicable | 92.2 | 90.1 | 85.3 | 81.8 | 72.5 | 61.9 | 61.4 |
| 2018 | Note ...: not applicable | Note ...: not applicable | 90.6 | 88.9 | 83.5 | 79.7 | 69.3 | 58.4 | 56.2 |
| 2019 | Note ...: not applicable | Note ...: not applicable | 89.4 | 88.0 | 82.3 | 78.4 | 67.0 | 55.2 | 53.8 |
|
... not applicable Note: There were no GSS cycles in 1987 and 1997, and data from 2002 and 2007 were excluded from the study since these cycles only included people aged 45 or more. Source: Statistics Canada, General Social Survey, 1985 to 2019. |
|||||||||
Data table for Chart 3
| Year | Year of birth | ||||||||
|---|---|---|---|---|---|---|---|---|---|
| 1910 to 1919 | 1920 to 1929 | 1930 to 1939 | 1940 to 1949 | 1950 to 1959 | 1960 to 1969 | 1970 to 1979 | 1980 to 1989 | 1990 to 1999 | |
| percentage | |||||||||
| 1985 | 56.4 | 58.9 | 48.9 | 42.7 | 31.5 | 32.3 | Note ...: not applicable | Note ...: not applicable | Note ...: not applicable |
| 1986 | 57.1 | 58.2 | 48.7 | 42.0 | 32.1 | 31.6 | Note ...: not applicable | Note ...: not applicable | Note ...: not applicable |
| 1988 | 57.9 | 57.4 | 47.8 | 39.8 | 32.3 | 28.9 | Note ...: not applicable | Note ...: not applicable | Note ...: not applicable |
| 1989 | 58.3 | 55.6 | 47.3 | 37.0 | 31.6 | 27.0 | Note ...: not applicable | Note ...: not applicable | Note ...: not applicable |
| 1990 | 55.7 | 54.2 | 46.3 | 36.3 | 29.7 | 24.3 | Note ...: not applicable | Note ...: not applicable | Note ...: not applicable |
| 1991 | 56.3 | 52.3 | 46.5 | 36.3 | 28.9 | 23.5 | Note ...: not applicable | Note ...: not applicable | Note ...: not applicable |
| 1992 | 55.7 | 52.2 | 45.2 | 37.6 | 28.7 | 23.2 | Note ...: not applicable | Note ...: not applicable | Note ...: not applicable |
| 1993 | 57.2 | 53.0 | 45.5 | 36.7 | 29.0 | 23.7 | Note ...: not applicable | Note ...: not applicable | Note ...: not applicable |
| 1994 | 56.3 | 52.3 | 45.2 | 34.9 | 28.1 | 24.4 | 21.6 | Note ...: not applicable | Note ...: not applicable |
| 1995 | 54.7 | 51.0 | 44.9 | 33.1 | 26.6 | 23.0 | 20.7 | Note ...: not applicable | Note ...: not applicable |
| 1996 | 57.0 | 51.7 | 45.6 | 33.0 | 25.6 | 23.0 | 18.8 | Note ...: not applicable | Note ...: not applicable |
| 1998 | 54.6 | 53.5 | 45.2 | 33.8 | 25.9 | 22.9 | 18.4 | Note ...: not applicable | Note ...: not applicable |
| 1999 | 56.2 | 54.0 | 46.2 | 34.3 | 26.1 | 23.0 | 18.3 | Note ...: not applicable | Note ...: not applicable |
| 2000 | Note ...: not applicable | 52.2 | 45.3 | 33.0 | 25.6 | 22.3 | 18.0 | Note ...: not applicable | Note ...: not applicable |
| 2001 | Note ...: not applicable | 51.8 | 47.0 | 33.6 | 25.1 | 22.5 | 18.5 | Note ...: not applicable | Note ...: not applicable |
| 2003 | Note ...: not applicable | 53.0 | 48.2 | 34.4 | 25.9 | 24.3 | 19.9 | Note ...: not applicable | Note ...: not applicable |
| 2004 | Note ...: not applicable | 53.6 | 50.1 | 36.4 | 28.1 | 26.4 | 21.8 | 24.2 | Note ...: not applicable |
| 2005 | Note ...: not applicable | 53.2 | 49.0 | 35.5 | 27.2 | 25.1 | 20.4 | 22.1 | Note ...: not applicable |
| 2006 | Note ...: not applicable | 52.0 | 48.1 | 34.6 | 25.6 | 23.6 | 18.8 | 19.8 | Note ...: not applicable |
| 2008 | Note ...: not applicable | 51.1 | 46.6 | 33.0 | 23.0 | 21.0 | 17.3 | 17.6 | Note ...: not applicable |
| 2009 | Note ...: not applicable | 50.6 | 47.8 | 33.5 | 22.3 | 20.3 | 17.6 | 17.6 | Note ...: not applicable |
| 2010 | Note ...: not applicable | Note ...: not applicable | 47.3 | 32.0 | 21.5 | 19.2 | 17.2 | 17.4 | Note ...: not applicable |
| 2011 | Note ...: not applicable | Note ...: not applicable | 45.9 | 31.0 | 21.2 | 18.9 | 17.3 | 17.0 | Note ...: not applicable |
| 2012 | Note ...: not applicable | Note ...: not applicable | 44.4 | 30.4 | 20.5 | 19.0 | 17.5 | 15.9 | Note ...: not applicable |
| 2013 | Note ...: not applicable | Note ...: not applicable | 44.1 | 30.8 | 21.1 | 18.8 | 17.6 | 15.4 | Note ...: not applicable |
| 2014 | Note ...: not applicable | Note ...: not applicable | 45.3 | 32.1 | 20.3 | 19.1 | 17.8 | 14.4 | 19.0 |
| 2015 | Note ...: not applicable | Note ...: not applicable | 45.2 | 32.2 | 20.3 | 19.0 | 17.7 | 14.4 | 17.8 |
| 2016 | Note ...: not applicable | Note ...: not applicable | 45.1 | 32.7 | 19.6 | 18.4 | 17.6 | 14.4 | 15.5 |
| 2017 | Note ...: not applicable | Note ...: not applicable | 42.1 | 31.1 | 19.1 | 17.2 | 16.4 | 13.6 | 14.5 |
| 2018 | Note ...: not applicable | Note ...: not applicable | 39.6 | 29.9 | 19.2 | 16.3 | 15.4 | 13.2 | 14.0 |
| 2019 | Note ...: not applicable | Note ...: not applicable | 37.3 | 28.7 | 18.8 | 15.9 | 14.6 | 12.6 | 14.0 |
|
... not applicable Note: There were no GSS cycles in 1987 and 1997, and data from 2002 and 2007 were excluded from the study since these cycles only included people aged 45 or more. In addition, the question on group religious practice was not asked in 2016. Missing values were replaced by the average of the preceding and following values. Source: Statistics Canada, General Social Survey, 1985 to 2019. |
|||||||||
Differences between people born in and outside Canada are more pronounced among younger cohorts
Those born outside Canada are a religiously diverse population, reflecting the wide variety of religious backgrounds from which they come and the life trajectories they have experienced.
During the 2017 to 2019 period, those born outside Canada (77%) were more likely to report having a religious affiliation than those born in Canada (72%) (data not presented). Like the Canadian-born population, the majority of those born outside Canada reported a Christian affiliation (51%) or no religious affiliation (23%). By contrast, those born outside Canada were significantly more likely than those born in Canada to report a Muslim (12% versus 1% among those born in Canada), Hindu (6% versus 0.3%), Sikh (4% versus 0.6%) or Buddhist (4% versus 0.6%) religious affiliation. They were also more likely to participate in a group religious activity at least once a month (36% versus 19%) and to engage in a religious or spiritual activity on their own at least once a week (42% versus 28%).
Among the population born in Canada, younger cohorts were significantly less likely than older cohorts to report having a religious affiliation and, when they did, they were less likely to consider their beliefs to be important to how they live their lives (32% of people born between 1980 and 1999 versus 48% and 62% of those born between 1960 and 1979 and between 1940 and 1959, respectively) (Chart 6). These trends, while present, were less pronounced among those born outside Canada, with older and younger cohorts being less distinct from one another.
Thus, overall, the differences between people born in Canada and those born outside Canada were more pronounced among the younger cohorts. For example, among younger individuals born between 1980 and 1999, those born outside Canada (71%) were more likely than those born in Canada (59%) to report having a religious affiliation. In comparison, among people born between 1940 and 1959, those born outside Canada (85%) were about as likely as those born in Canada (87%) to report having a religious affiliation.
In addition, among the youngest age group, born between 1980 and 1999, those born outside Canada (62%) were significantly more likely than those born in Canada (39%) to consider their religious beliefs to be somewhat or very important. This difference was less pronounced among older cohorts.

Data table for Chart 6
| Year and place of birth | Affiliated—Beliefs not very important or not important at all | Affiliated—Beliefs somewhat important or very important | Non-affiliated—Beliefs not very important or not important at all | Non-affiliated—Beliefs somewhat important or very important | |
|---|---|---|---|---|---|
| percentage | |||||
| Born in Canada (ref.) | 1940 to 1959 | 25 | 62 | 9 | 4 |
| 1960 to 1979 | 29 | 48 | 17 | 6 | |
| 1980 to 1999 | 27 | 32 | 34 | 7 | |
| Born outside Canada | 1940 to 1959 | 16Note * | 69Note * | 10 | 5 |
| 1960 to 1979 | 13Note * | 68Note * | 15Note * | 4Note * | |
| 1980 to 1999 | 14Note * | 57Note * | 24Note * | 5Note * | |
|
|||||
In terms of participation in religious or spiritual activities (Chart 7), the most significant difference between people born in Canada and those born outside Canada was for participation in group religious activities. From 2017 to 2019, 36% of those born outside Canada participated in group religious activities at least once a month, compared with 19% of those born in Canada. The greater tendency among immigrants to attend religious services is often attributed to the importance of religious communities as a place of social integration, especially in the first years after arriving in the country.Note
Again, the differences between those born outside Canada and those born in Canada were more pronounced among the younger cohorts. For example, those born outside Canada between 1980 and 1999 (30%) were significantly more likely than their Canadian-born counterparts (13%) to participate monthly in group religious activities.
However, significant differences by birth in Canada or outside Canada were also observed among older cohorts. For example, among those born outside Canada between 1940 and 1959, 38% participated monthly in group religious activities, compared with 23% of their Canadian-born counterparts.

Data table for Chart 7
| Year and place of birth | No group or individual participation | In groups or individually at least once during the year (not included elsewhere) | In groups less than once a month, but individually at least once a week | In groups at least once a month | |
|---|---|---|---|---|---|
| percentage | |||||
| Born in Canada (ref.) | 1940 to 1959 | 40 | 19 | 18 | 23 |
| 1960 to 1979 | 44 | 25 | 15 | 16 | |
| 1980 to 1999 | 50 | 27 | 9 | 13 | |
| Born outside Canada | 1940 to 1959 | 29Note * | 17 | 15Note * | 38Note * |
| 1960 to 1979 | 28Note * | 20Note * | 14 | 38Note * | |
| 1980 to 1999 | 34Note * | 22Note * | 13Note * | 30Note * | |
Source: Statistics Canada, General Social Survey, cycles 31 to 34, 2017 to 2019. |
|||||
Religiosity varies across Canada
The measures of religiosity also vary across Canada. In fact, the diversity of regional dynamics has long been a fundamental characteristic of religion in Canada.Note
For Ontario and the Prairies, the patterns are similar to those presented so far (charts 8 and 9). Therefore, the focus here will be on the three other regions: British Columbia, Quebec and the Atlantic provinces.
Data table for Chart 8
| Province of residence and year of birth | Affiliated—Beliefs not very important or not important at all | Affiliated—Beliefs somewhat important or very important | Non-affiliated—Beliefs not very important or not important at all | Non-affiliated—Beliefs somewhat important or very important | |
|---|---|---|---|---|---|
| percentage | |||||
| British Columbia | 1940 to 1959 |
19 | 53Note * | 19Note * | 8Note * |
| 1960 to 1979 |
15Note * | 46Note * | 29Note * | 9Note * | |
| 1980 to 1999 |
12Note * | 34Note * | 44Note * | 9Note * | |
| Prairies | 1940 to 1959 |
17 | 66 | 11 | 6Note * |
| 1960 to 1979 |
15Note * | 60 | 19Note * | 7Note * | |
| 1980 to 1999 |
14Note * | 47 | 31 | 8 | |
| Ontario (ref.) | 1940 to 1959 |
19 | 68 | 9 | 4 |
| 1960 to 1979 |
20 | 60 | 16 | 5 | |
| 1980 to 1999 |
21 | 43 | 30 | 6 | |
| Quebec | 1940 to 1959 |
35Note * | 58Note * | 5Note * | 2Note * |
| 1960 to 1979 |
44Note * | 44Note * | 10Note * | 3Note * | |
| 1980 to 1999 |
42Note * | 28Note * | 26 | 4 | |
| Atlantic provinces | 1940 to 1959 |
18 | 74Note * | 5Note * | 3Note * |
| 1960 to 1979 |
26Note * | 58 | 13Note * | 4 | |
| 1980 to 1999 |
29Note * | 37Note * | 27 | 6 | |
Source: Statistics Canada, General Social Survey, cycles 31, 32 and 34, 2017 to 2019. |
|||||

Data table for Chart 9
| Province of residence and year of birth | No group or individual participation | In groups or individually at least once during the year (not included elsewhere) | In groups less than once a month, but individually at least once a week | In groups at least once a month | |
|---|---|---|---|---|---|
| percentage | |||||
| British Columbia | 1940 to 1959 |
48Note * | 16Note * | 15 | 22Note * |
| 1960 to 1979 |
47Note * | 19Note * | 13 | 21Note * | |
| 1980 to 1999 |
49Note * | 23Note * | 10 | 18 | |
| Prairies | 1940 to 1959 |
36 | 17 | 17 | 30 |
| 1960 to 1979 |
36 | 21 | 15 | 29 | |
| 1980 to 1999 |
43 | 22Note * | 11 | 23 | |
| Ontario (ref.) | 1940 to 1959 |
34 | 19 | 16 | 31 |
| 1960 to 1979 |
34 | 23 | 15 | 28 | |
| 1980 to 1999 |
42 | 27 | 10 | 21 | |
| Quebec | 1940 to 1959 |
39Note * | 23Note * | 21Note * | 18Note * |
| 1960 to 1979 |
47Note * | 27Note * | 15 | 11Note * | |
| 1980 to 1999 |
54Note * | 28 | 11 | 8Note * | |
| Atlantic provinces | 1940 to 1959 |
29Note * | 18 | 17 | 36Note * |
| 1960 to 1979 |
38Note * | 28Note * | 16 | 18Note * | |
| 1980 to 1999 |
48Note * | 26 | 11 | 15Note * | |
Source: Statistics Canada, General Social Survey, cycles 31 to 34, 2017 to 2019. |
|||||
In British Columbia, a strong disaffiliation trend and stable but low participation in religious activities
From 2017 to 2019, British Columbia has been characterized by large proportions of people who reported having no religious affiliation (40%) and never having engaged in any group or individual religious or spiritual activities in the past year (47%).
High proportions of non-affiliation have distinguished British Columbia for several decades. For example, in 1985, 25% of people aged 15 and older living in British Columbia reported having no religious affiliation, compared with 9% in the rest of Canada. Data from the 1901 Census show that even then, a higher proportion of British Columbians reported having no religious affiliation (1.5%, compared with 0.16% elsewhere in Canada). They were also less likely than their counterparts in the eastern provinces to attend churches and places of worship.Note Various studies have attempted to link this distinctive regional difference to historical circumstances. It has been suggested that the establishment of religious organizations in British Columbia in the late 19th and early 20th centuries may have been more uneven than elsewhere in Canada, leaving more room to religious non-affiliation.Note
It has been suggested that British Columbia’s unique non-affiliation situation may be attributable to the high level of immigration from East Asia (particularly China) as many of these immigrants do not reporting a religious affiliation.Note However, overall, immigrants and the children of immigrants in British Columbia were less likely (36%) than people in the third generation or more (45%) to report having no religious affiliation.Note Thus, the province’s unique situation is not simply a matter of immigration, or at least not recent immigration.
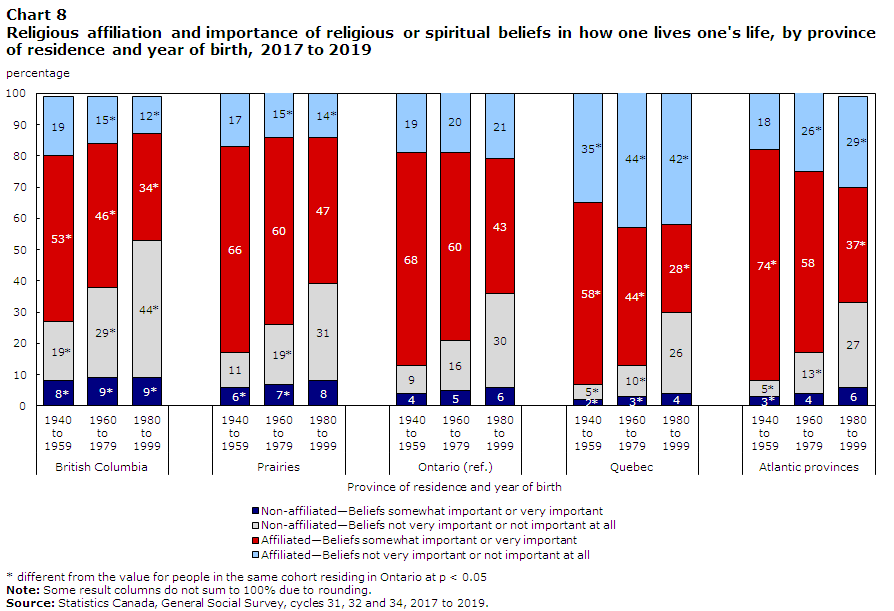
This non-affiliation trend was even more pronounced among younger cohorts (Chart 8). For example, from 2017 to 2019, more than half (53%) of people born between 1980 and 1999 reported having no religious affiliation, compared with 38% of those born between 1960 and 1979 and 27% of those born between 1940 and 1959. Most notably, the proportion of people who simultaneously reported having no religion and placing little or no importance on their beliefs was greater among the younger generations.
However, these intergenerational differences in affiliation and importance of beliefs do not translate into significant differences in group or individual religious or spiritual activities (Chart 9). The proportions of people who participated in a group religious activity at least once a month (between 18% and 22%) and those who did not engage in a group or individual religious activity in the past year (between 47% and 49%) were similar across cohorts.
In Quebec, high religious affiliation but low participation in religious activities
From 2017 to 2019, Quebec was distinguished from the other provinces because it had the highest proportion of people who simultaneously reported having a religious affiliation and who considered their religious or spiritual beliefs not very important or not important at all to how they live their lives (40%, compared with proportions ranging from 15% to 25% in the other provinces). Quebec also had the lowest proportion of people participating in group religious activities at least once a month (14%, compared with 21% to 32% in the other provinces).
This relatively low rate of participation in group religious activities highlights important changes observed over the last decades in the province, particularly among Catholics. In 1985,Note about half (48%) of people aged 15 and older in Quebec participated in religious activities at least once a month. Among Catholics, this rate was 51%, while among those who reported having a religious affiliation other than Catholic, it was 42%. From 2017 to 2019, monthly group religious participation rates were 14% for Catholics and 26% for those who reported having a religious affiliation other than Catholic. It is worth noting that from 1985 to the 2017-to-2019 period in Quebec, the share of Catholics among the population aged 15 and older declined from 87% to 62%; at the same time, the proportion of people with a religious affiliation other than Catholic doubled, from 9% in 1985 to 18% for the 2017-to-2019 period.
There were some notable differences between different birth cohorts in Quebec which contributed to these changes in participation in religious activities over time (Chart 9). For example, those born between 1980 and 1999 (19%) were half as likely as those born between 1940 and 1959 (39%) to participate in a group religious activity at least once a month or a religious activity on their own at least once a week.
There were also significant contrasts between cohorts with respect to religious affiliation and the importance placed on religious or spiritual beliefs, but, in all cases, the situation in Quebec differed from that in other parts of the country (Chart 8). From 2017 to 2019, younger cohorts were more likely to report having no religious affiliation (30% of those born between 1980 and 1999, compared with 13% of those born between 1960 and 1979, and 7% of those born between 1940 and 1959). These proportions were each lower than those observed among the similarly-aged cohorts elsewhere in Canada.Note
However, from one birth cohort to the next, a growing share—always greater than elsewhere in the country—of those who reported having a religious affiliation also indicated that their religious beliefs were not very important or not important at all to the way they lived their life. This was the case for 42% of Quebec residents born between 1940 and 1959, 50% of those born between 1960 and 1979, and 62% of those born between 1980 and 1999.
In short, the combination of affiliation to a specific religion, low importance given to beliefs and low participation in religious activities is significantly more prevalent in Quebec than elsewhere in Canada. Some authors have used the term “cultural Catholicism” to describe this trend, which would be particularly present among Quebec Catholics, of maintaining an identification with Catholicism while giving only a limited place to religion in daily life.Note
In the Atlantic provinces, the contrasts between generations were particularly pronounced
In recent decades, the Atlantic provinces have tended to be considered the most religiously stable provinces, especially in terms of religious affiliation.Note This finding of relative religious stability tends to extend throughout the 20th century.Note
However, the data from 2017 to 2019 reveal particularly sharp contrasts between the oldest and youngest cohorts in this region (charts 8 and 9). For example, from 2017 to 2019, 36% of those born between 1940 and 1959 participated in a group religious activity at least once a month, compared with 15% of those born between 1980 and 1999. Moreover, among people from the youngest cohort, about half (48%) never participated in a group or individual religious activity in the past year, a proportion similar to that observed among people of the same age living in British Columbia.
The same differences between cohorts were found in terms of religious affiliation and the importance given to beliefs. Those born between 1940 and 1959 (74%) were twice as likely as those born between 1980 and 1999 (37%) to report having a religious affiliation and to consider their religious or spiritual beliefs to be somewhat or very important.
Conclusion
Several often divergent explanations, have been offered to describe the ongoing changes in religion in Canada and other countries. The purpose of this study is not to comment on these theoretical considerations, but rather to highlight data from several cycles of the General Social Survey that provide food for thought on religion in Canada and its evolution.
Religious affiliation, the frequency of group and individual religious activities, and the importance of religious or spiritual beliefs in the way people live their lives have tended to decline in recent decades. These changes stem first from the succession of cohorts that gradually exhibit fewer of these forms of religiosity, and then, to a lesser extent, from changes within each cohort over time. These findings regarding the crucial role of cohorts in explaining religious changes are consistent with those of other studies on religious dynamics in Canada and elsewhere in the world.Note
Beyond the differences between cohorts, some changes within each cohort were also identified. For example, in virtually all cohorts, the frequency of group and individual religious activities and the importance attached to religious and spiritual beliefs tended to decline over time. Religious affiliation within each cohort is more stable, although there have been some fluctuations.
Different regions of Canada are characterized by their own dynamics. For example, in British Columbia, the proportion of people who reported having no religious affiliation is the highest in Canada and tends to increase across cohorts. However, these cohorts differ little in their practice of group or individual religious activities.
In Quebec, non-affiliation is low, but religious affiliation is more often combined with a low level of importance given to religious or spiritual beliefs. Participation in religious activities, especially group activities, is also less frequent in Quebec than elsewhere.
In the Atlantic provinces, the contrasts between generations are more marked, suggesting that significant changes in the religious landscape are taking place.
While only a few factors have been explored in this study, the diversity of regional religious differences in Canada is significant and could be further explored. Beyond geographic variations, variations by religious denomination, country of birth or different ethnocultural characteristics also merits further investigation. And it is quite possible that regional differences will continue to grow in the future, especially given the widely varying levels of immigration and composition of immigrants across different regions of Canada.
The few indicators analyzed in this study cannot summarize the entirety of people’s relationship to religion, and several other measures of religiosity exist. In any case, taking several forms of religiosity into account simultaneously, beyond simple identification with a religion, results in a more complex picture of religious diversity in Canada and its trends. This portrait will help contextualize and interpret the upcoming 2021 Census results, which will describe the religious affiliations of Canadians in greater detail, especially geographically. The 2021 Census results will not, however, capture other important aspects of an individual’s relationship with religion, such as those covered in this study.
Louis Cornelissen is an analyst at the Centre for Demography at Statistics Canada.
Start of text boxAppendix
Data table for Chart 4
| Year | Year of birth | |||||||
|---|---|---|---|---|---|---|---|---|
| 1920 to 1929 | 1930 to 1939 | 1940 to 1949 | 1950 to 1959 | 1960 to 1969 | 1970 to 1979 | 1980 to 1989 | 1990 to 1999 | |
| percentage | ||||||||
| 2006 | 66.0 | 58.6 | 52.6 | 45.3 | 40.3 | 34.6 | 31.0 | Note ...: not applicable |
| 2008 | 66.6 | 59.1 | 52.9 | 44.9 | 38.3 | 34.4 | 26.1 | Note ...: not applicable |
| 2009 | 63.5 | 55.6 | 52.2 | 43.7 | 35.5 | 30.6 | 24.8 | Note ...: not applicable |
| 2010 | Note ...: not applicable | 61.1 | 50.0 | 42.4 | 36.6 | 32.3 | 26.8 | Note ...: not applicable |
| 2011 | Note ...: not applicable | 57.4 | 47.6 | 42.2 | 36.2 | 29.6 | 25.5 | Note ...: not applicable |
| 2012 | Note ...: not applicable | 57.9 | 52.4 | 46.4 | 37.5 | 31.6 | 27.9 | Note ...: not applicable |
| 2013 | Note ...: not applicable | 57.1 | 49.0 | 38.7 | 34.2 | 29.9 | 22.7 | Note ...: not applicable |
| 2014 | Note ...: not applicable | 53.4 | 47.0 | 39.8 | 35.0 | 29.2 | 23.5 | 21.9 |
| 2015 | Note ...: not applicable | 57.3 | 46.4 | 38.3 | 36.8 | 31.6 | 25.6 | 22.9 |
| 2017 | Note ...: not applicable | 55.0 | 46.5 | 37.0 | 34.4 | 29.2 | 25.8 | 21.0 |
| 2018 | Note ...: not applicable | 47.6 | 39.2 | 31.2 | 26.7 | 23.4 | 19.1 | 17.9 |
| 2019 | Note ...: not applicable | 48.9 | 38.4 | 31.1 | 26.1 | 24.8 | 19.6 | 16.0 |
|
... not applicable Note: Data from 2007 were excluded from the study since this cycle only included people aged 45 or more. In addition, the question on individual religious practice was not asked in 2016. Source: Statistics Canada, General Social Survey, 2006 to 2019. |
||||||||

Data table for Chart 5
| Year | Year of birth | |||||||
|---|---|---|---|---|---|---|---|---|
| 1920 to 1929 | 1930 to 1939 | 1940 to 1949 | 1950 to 1959 | 1960 to 1969 | 1970 to 1979 | 1980 to 1989 | 1990 to 1999 | |
| percentage | ||||||||
| 2003 | 87.3 | 85.6 | 79.3 | 74.2 | 67.6 | 59.5 | Note ...: not applicable | Note ...: not applicable |
| 2004 | 85.7 | 84.0 | 77.1 | 73.2 | 67.3 | 60.2 | 51.2 | Note ...: not applicable |
| 2005 | 85.7 | 82.8 | 80.5 | 73.7 | 67.8 | 58.8 | 47.3 | Note ...: not applicable |
| 2006 | 87.7 | 84.6 | 78.9 | 73.4 | 68.9 | 60.9 | 51.9 | Note ...: not applicable |
| 2008 | 89.1 | 85.5 | 79.3 | 72.1 | 69.3 | 59.0 | 48.5 | Note ...: not applicable |
| 2009 | 84.9 | 82.5 | 78.9 | 69.5 | 65.3 | 54.8 | 46.4 | Note ...: not applicable |
| 2010 | Note ...: not applicable | 82.8 | 77.8 | 68.0 | 65.0 | 56.5 | 49.0 | Note ...: not applicable |
| 2011 | Note ...: not applicable | 83.2 | 76.7 | 68.3 | 65.1 | 58.0 | 48.3 | Note ...: not applicable |
| 2012 | Note ...: not applicable | 79.8 | 74.5 | 67.3 | 61.7 | 55.3 | 47.5 | Note ...: not applicable |
| 2013 | Note ...: not applicable | 85.2 | 78.1 | 68.4 | 64.8 | 59.4 | 46.1 | Note ...: not applicable |
| 2014 | Note ...: not applicable | 81.6 | 74.9 | 67.1 | 63.3 | 54.2 | 45.3 | 39.6 |
| 2015 | Note ...: not applicable | 82.2 | 76.2 | 64.7 | 61.0 | 55.4 | 42.3 | 37.7 |
| 2016 | Note ...: not applicable | 78.4 | 68.9 | 59.7 | 55.3 | 45.9 | 37.9 | 37.5 |
| 2017 | Note ...: not applicable | 83.3 | 74.3 | 67.7 | 62.6 | 54.7 | 44.6 | 39.4 |
| 2018 | Note ...: not applicable | 76.9 | 67.8 | 59.7 | 53.9 | 46.6 | 37.2 | 37.8 |
| 2019 | Note ...: not applicable | 78.0 | 69.0 | 60.0 | 52.9 | 45.7 | 40.2 | 33.7 |
|
... not applicable Note: Data from 2007 were excluded from the study since this cycle only included people aged 45 or more. Source: Statistics Canada, General Social Survey, 2003 to 2019. |
||||||||
End of text box
Start of text boxData sources, methods and definitions
Data sources
The data used are from most cycles of the General Social Survey (GSS). For longitudinal analyses, cycles 1 (1985) to 34 (2019) are used, with the exception of cycles 16 (2002) and 21 (2007), which covered only people aged 45 and older. In cycle 27 (2013), the “Social Identity” version of the survey was used.
The selected cycles of the GSS have representative samples of the Canadian population aged 15 and older living in the provinces (excluding the territories). Sample sizes vary considerably from year to year but are generally between 10,000 and 30,000 people.Note
Cross-sectional analyses for 2017 to 2019
To benefit from a larger sample and better quality estimates, cross-sectional analyses were conducted by averaging the values obtained for GSS cycles 31 (2017), 32 (2018), 33 (2018) and 34 (2019).
However, information on the importance given to religious and spiritual beliefs is not available for cycle 33 (2018). Data from this cycle are excluded for this indicator. In all cases, the results are presented as corresponding to the period from 2017 to 2019.
Religious affiliation
Variable available from 1985 to 2019 (cycles 1 to 34).
Two variations of this question exist:
- 1985 to 1993 (cycles 1 to 8) and 1999 to 2011 (cycles 13 to 25): “What, if any, is your religion?”
- 1994 to 1998 (cycles 9 to 12) and 2012 to 2019 (cycles 26 to 34): “What is your religion?”
For Table 3, religious affiliations reported in cycles 31 to 34 were categorized to match the aggregated version of the religion list in the new “Religion of person” standard, adopted in 2020 for the release of the 2021 Census data.Note The “Reformed” and “Presbyterian” categories are presented together, however, since they could not be distinguished in the GSS data.
Participation in group religious activities
Variable available from 1985 to 2019 (cycles 1 to 34, excluding cycle 30 [2016]).
Question: “Not counting events such as weddings or funerals, during the past 12 months, how often did you participate in religious activities or attend religious services or meetings?” (cycle 32)
The wording of the question has changed slightly over time, but without major changes. The answer choices have varied slightly over time. For data from a few cycles, some answer choices were grouped together to obtain a harmonized variable.
From 1985 to 2004 (cycles 1 to 18), this question was not asked of those who reported not having a religion. To measure monthly participation for 1985 to 2004, individuals who reported having no religious affiliation were treated as if they had reported participating in a religious activity less than once a month. In 2005, 5% of those who reported having no religious affiliation participated in a group religious activity at least once a month. This should have produced a slight underestimate of the proportion of people participating in religious activities at least once a month from 1985 to 2004 (between 0.5% and 1%, depending on the cycle, if the proportion measured in 2005 remained constant).
Individual religious or spiritual activities
Variable available from 2006 to 2019 (cycles 20 to 34, excluding cycle 30 [2016]).
Question: “In the past 12 months, how often did you engage in religious or spiritual activities on your own? Include prayer, meditation and other forms of devotion taking place in your home or elsewhere.” (cycle 32)
The question has not changed significantly over time. However, the response choices changed beginning in 2012 (cycle 26) to include the category “At least once a day.” Previously, the highest frequency available was “At least once a week.”
Importance of religious beliefs in how to live one’s life
Variable available from 2003 to 2019 (cycles 17 to 34).
Question: “How important are your religious or spiritual beliefs to the way you live your life?” (cycle 32)
The question has remained virtually unchanged over time. In French only, the term “convictions” replaced the term “croyances,” which was used from 2003 to 2005 (cycles 17 to 19).
End of text box
- Date modified: