
 StatCan COVID-19: Data to Insights for a Better Canada Retail e-commerce and COVID-19: How online shopping opened doors while many were closing

Archived Content
Information identified as archived is provided for reference, research or recordkeeping purposes. It is not subject to the Government of Canada Web Standards and has not been altered or updated since it was archived. Please "contact us" to request a format other than those available.
by Jason Aston, Owen Vipond, Kyle Virgin, Omar Youssouf
Text begins
In March 2020, new measures aimed at slowing the spread of COVID-19 significantly affected how consumers made retail purchases. With businesses closing and changing their in-store operations, and consumers having to physically distance, the option to purchase online became an important alternative to walking into a Canadian retail store. From February to May 2020, total retail sales fell 17.9%. However, retail e-commerce sales nearly doubled (+99.3%), with some retailers relying more on this method of sale.
This study explores the different e-commerce trends observed across industries in the Canadian retail trade sector.Note The data in this paper will be updated to reflect the evolving conditions of the retail trade sector in Canada. These updates will also allow for the impact of this method of sale to be assessed in the longer term, including whether retail e-commerce will return to levels seen before the COVID-19 pandemic.
Retail e-commerce sales soar to all-time high
Retail e-commerce sales reached a record $3.9 billion in May, a 2.3% increase over April and 99.3% increase over February ($2.0 billion). Year over year, e-commerce sales more than doubled—with a 110.8% increase compared with May 2019.
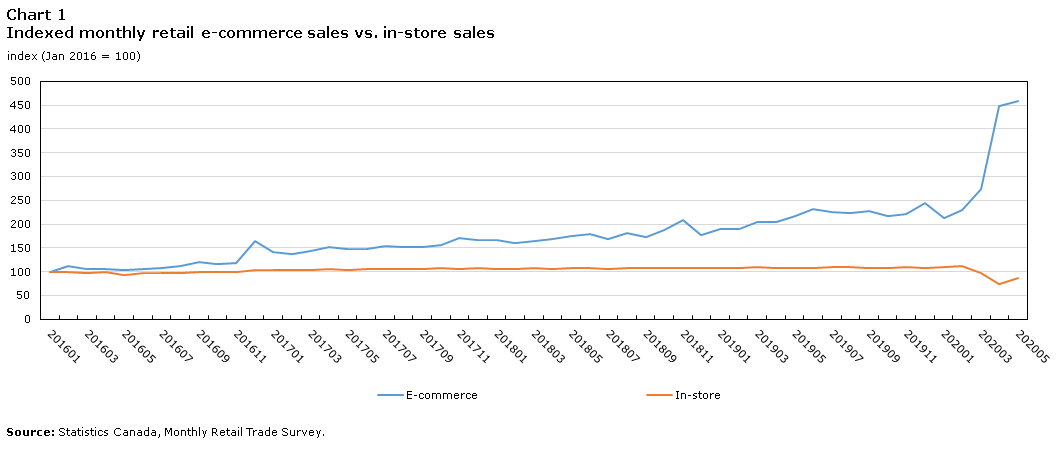
These record gains in e-commerce occurred as total retail sales experienced record declines. The impact of COVID-19 is best highlighted using April data. Retail sales plummeted to $33.9 billion in April, a 29.1% decline from February and a 26.4% decline from April 2019. While e-commerce saw a 63.8% monthly increase in April, in-store sales dropped 25.3% (Chart 1). In May, total retail sales started to recover, reaching $39.3 billion.
Data table for Chart 1
| 201601 | 201602 | 201603 | 201604 | 201605 | 201606 | 201607 | 201608 | 201609 | 201610 | 201611 | 201612 | 201701 | 201702 | 201703 | 201704 | 201705 | 201706 | 201707 | 201708 | 201709 | 201710 | 201711 | 201712 | 201801 | 201802 | 201803 | 201804 | 201805 | 201806 | 201807 | 201808 | 201809 | 201810 | 201811 | 201812 | 201901 | 201902 | 201903 | 201904 | 201905 | 201906 | 201907 | 201908 | 201909 | 201910 | 201911 | 201912 | 202001 | 202002 | 202003 | 202004 | 202005 | |
|---|---|---|---|---|---|---|---|---|---|---|---|---|---|---|---|---|---|---|---|---|---|---|---|---|---|---|---|---|---|---|---|---|---|---|---|---|---|---|---|---|---|---|---|---|---|---|---|---|---|---|---|---|---|
| index (Jan 2016 = 100) | |||||||||||||||||||||||||||||||||||||||||||||||||||||
| E-commerce | 100.0 | 110.8 | 105.1 | 105.8 | 104.3 | 105.6 | 107.8 | 111.1 | 120.0 | 115.6 | 117.9 | 165.0 | 140.9 | 136.5 | 142.8 | 150.8 | 147.0 | 147.8 | 152.9 | 152.5 | 151.9 | 156.1 | 169.7 | 165.7 | 165.7 | 159.2 | 163.8 | 167.6 | 174.2 | 178.6 | 167.9 | 180.5 | 172.0 | 188.0 | 207.4 | 177.8 | 189.1 | 188.7 | 204.0 | 203.4 | 217.7 | 232.5 | 225.8 | 223.6 | 228.0 | 217.7 | 220.2 | 244.5 | 213.6 | 230.2 | 273.8 | 448.6 | 459.0 |
| In-store | 100.0 | 99.5 | 96.0 | 100.1 | 93.6 | 96.9 | 97.6 | 96.4 | 99.3 | 99.4 | 98.9 | 103.0 | 103.0 | 103.1 | 103.1 | 105.1 | 103.2 | 105.0 | 104.9 | 105.0 | 105.0 | 106.9 | 105.7 | 106.5 | 105.2 | 105.5 | 107.3 | 104.5 | 107.9 | 108.1 | 105.9 | 107.8 | 108.4 | 108.4 | 107.5 | 108.1 | 107.9 | 107.5 | 108.9 | 107.7 | 108.4 | 107.7 | 108.8 | 109.9 | 107.6 | 108.4 | 108.9 | 108.3 | 110.2 | 111.4 | 97.8 | 73.0 | 85.9 |
| Source: Statistics Canada, Monthly Retail Trade Survey. | |||||||||||||||||||||||||||||||||||||||||||||||||||||
Retail e-commerce sales have risen steadily, with the proportion of online sales rising from 2.4% in 2016 to 4.0% in 2019. The month of April highlights the peak of the COVID-19 impact, with the proportion of retail e-commerce sales jumping from 3.8% in April 2019 to a record high of 11.4% in April 2020. In May, as the Canadian retail environment allowed for more in-store purchases, the proportion of retail e-commerce sales was 10.0%.
E-commerce sales increased more among non-essential retailers
All 11 retail trade subsectors with e-commerce sales saw an increase in online sales as a result of COVID-19 (Chart 2). From February to April 2020, only the food and beverage subsector experienced an increase in in-store sales (+3.3%) and a surge in e-commerce (+107.0%). In-store sales declined for general merchandise stores (-15.1%), building material and garden equipment and supplies dealers (-15.8%), and health and personal care stores (-16.1%). These subsectors had relatively moderate declines compared with other brick-and-mortar operations.
In contrast, other retail trade subsectors—such as furniture and home furnishings stores (-69.6%); sporting goods, hobby, book and music stores (-79.0%); and clothing and clothing accessories stores (-84.2%)—saw much sharper declines in in-store sales from February to April 2020. As in-store sales decreased for these subsectors, e-commerce sales increased.

Data table for Chart 2
| In-store | E-commerce | |
|---|---|---|
| percent | ||
| Retail trade [44-45] | -34.5 | 94.8 |
| Furniture and home furnishings stores [442] | -69.6 | 191.2 |
| General merchandise stores [452] | -15.1 | 170.1 |
| Sporting goods, hobby, book and music stores [451] | -79.0 | 154.9 |
| Food and beverage stores [445] | 3.3 | 107.0 |
| Clothing and clothing accessories stores [448] | -84.2 | 83.3 |
| Health and personal care stores [446] | -16.1 | 55.6 |
| Building material and garden equipment and supplies dealers [444] | -15.8 | 40.5 |
| Source: Statistics Canada, Monthly Retail Trade Survey. | ||
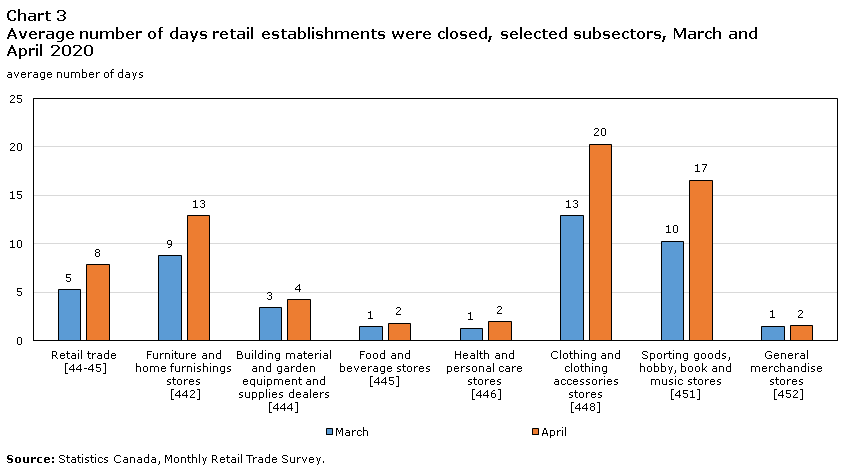
Mandated business closures that prevented retailers from making traditional in-store sales resulted in a greater shift toward e-commerce. Meanwhile, food and beverage stores—essential services that were allowed to remain open—saw a 38% increase in grocery sales in the second week of March compared with 2019, and a surge in sales of certain personal care products.Note For these subsectors, the importance of in-store sales is evident since e-commerce was not the only method of sale available, unlike for certain non-essential retailers. In general, the subsectors that had more establishments that were mandated to close (Chart 3) became more reliant on e-commerce.
Data table for Chart 3
| March | April | |
|---|---|---|
| average number of days | ||
| Retail trade [44-45] | 5 | 8 |
| Furniture and home furnishings stores [442] | 9 | 13 |
| Building material and garden equipment and supplies dealers [444] | 3 | 4 |
| Food and beverage stores [445] | 1 | 2 |
| Health and personal care stores [446] | 1 | 2 |
| Clothing and clothing accessories stores [448] | 13 | 20 |
| Sporting goods, hobby, book and music stores [451] | 10 | 17 |
| General merchandise stores [452] | 1 | 2 |
| Source: Statistics Canada, Monthly Retail Trade Survey. | ||
Long-term impact
Will the COVID-19 pandemic have a lasting impact on the retail trade sector? Small businesses are increasingly turning to e-commerce platforms, and are using these platforms in innovative ways.Note The degree to which Canadians continue to choose e-commerce purchasing options or return to traditional purchasing methods has the potential to change the structure of the retail trade industry in Canada. Clearly, the retail landscape will evolve.
Note to readers
All data in this paper are seasonally adjusted and are expressed in current dollars, unless otherwise noted.
A standard usage of the North American Industry Classification System (NAICS) groups all internet-only retailers together under NAICS code 45411, regardless of their associated retail subsector. For this study, to determine e-commerce sales by subsector, establishments classified under NAICS 45411 were combined with their brick-and-mortar retail NAICS code. In addition, establishments with no related brick-and-mortar retail NAICS code were assigned a new code based on the products they sell. This results in different figures when comparing the data in this paper with data from Statistics Canada’s Monthly Retail Trade releases.
Goods and services sold to Canadian consumers online from legal entities operating in foreign countries are not included in Canadian retail sales figures.
| NAICS | Method | 2016 | 2017 | 2018 | 2019 | 2020 (Jan. to May) |
|---|---|---|---|---|---|---|
| % | ||||||
| Retail trade [44-45] | In store | 97.6 | 97.1 | 96.7 | 96.0 | 93.4 |
| E-commerce | 2.4 | 2.9 | 3.3 | 4.0 | 6.6 | |
| Motor vehicle and parts dealers [441] | In store | 99.6 | 99.4 | 99.1 | 98.5 | 98.2 |
| E-commerce | 0.4 | 0.6 | 0.9 | 1.5 | 1.8 | |
| Furniture and home furnishings stores [442] | In store | 97.8 | 96.9 | 95.3 | 93.4 | 83.6 |
| E-commerce | 2.2 | 3.1 | 4.7 | 6.6 | 16.4 | |
| Electronics and appliance stores [443] | In store | 83.0 | 81.7 | 79.2 | 71.0 | 56.5 |
| E-commerce | 17.0 | 18.3 | 20.8 | 29.0 | 43.5 | |
| Building material and garden equipment and supplies dealers [444] | In store | 99.3 | 99.0 | 99.0 | 98.8 | 98.4 |
| E-commerce | 0.7 | 1.0 | 1.0 | 1.2 | 1.6 | |
| Food and beverage stores [445] | In store | 99.7 | 99.5 | 99.4 | 99.3 | 98.8 |
| E-commerce | 0.3 | 0.5 | 0.6 | 0.7 | 1.2 | |
| Health and personal care stores [446] | In store | 98.4 | 96.4 | 96.3 | 94.5 | 92.7 |
| E-commerce | 1.6 | 3.6 | 3.7 | 5.5 | 7.3 | |
| Clothing and clothing accessories stores [448] | In store | 91.6 | 92.0 | 91.1 | 89.4 | 76.4 |
| E-commerce | 8.4 | 8.0 | 8.9 | 10.6 | 23.6 | |
| Sporting goods, hobby, book and music stores [451] | In store | 93.5 | 91.1 | 89.5 | 87.7 | 73.0 |
| E-commerce | 6.5 | 8.9 | 10.5 | 12.3 | 27.0 | |
| General merchandise stores [452] | In store | 97.5 | 97.4 | 97.1 | 97.1 | 95.0 |
| E-commerce | 2.5 | 2.6 | 2.9 | 2.9 | 5.0 | |
| Miscellaneous store retailers [453] | In store | 87.5 | 82.6 | 83.6 | 85.4 | 80.4 |
| E-commerce | 12.5 | 17.4 | 16.4 | 14.6 | 19.6 | |
- Date modified: