
Economic Insights
The Effect of Robots on Firm Performance and Employment
This article examines the impact of robot investment on firm performance and employment at the enterprise level. The analysis is based on a data set on robot purchases derived from data on imports, combined with data from National Accounts Longitudinal Microdata File (NALMF) and from the Workplace and Employee Survey (WES). Investments in robots have been concentrated in the manufacturing sector, with the automotive industry making particularly large investments prior to the year 2008. Recent investments have been in robots with a broader range of capabilities performing tasks in a broader range of industries. Robots raise firms’ productivity, but they are associated with the firm hiring more, rather than fewer workers. Robots appear to change the types of human skills firms require, however.
Introduction
Fears of artificially intelligent machines have lingered in the human imagination for thousands of years. Millennia ago, Greek myths like those of Talus or Pandora told of artificial beings created by the gods wreaking chaos and destruction when they are sent among mortals on Earth. Science fiction has picked up this ancient theme in the last century: Karel Čapek's 1920 play R.U.R.: Rossum's Universal Robots implanted the word “robot” in the global lexicon and imagination. Named for the Czech word robota (the serfs' obligation of labour to their feudal masters) Rossum’s artificially intelligent automatons eventually revolt and exterminate their human masters.Note
Recent breakthroughs in AI have focussed attention on robots as potential job killers. Autor and Salomons (2017) coined the term robocalypse to describe a vision of the future “where the endless march of technology ultimately immiserates labor”. Some observers have argued that the robocalypse is nearer than society is prepared for, and advocate policy interventions to slow the process of robot adoption. Other observers are sanguine, believing that robots are little different from previous waves of automation that created enough tasks for humans to compensate for the workers new machines displaced. Although switching workers to other tasks was often fraught and not all of them could benefit, past automation generated for labour as a whole a roughly constant share of rapidly increasing output.
Whether robotic automation is playing out like its non-robotic predecessors or heralding the robocalypse is ultimately an empirical question. The study introduced in this article uses newly constructed firm-level administrative data for the years 1996-2017 to examine what kind of Canadian firms are investing in robots and what happens to their workers when they do. It shows that robots investment has been concentrated in certain manufacturing industries, but is now spreading to other areas of the economy. Firms adopting them tend to hire more, not fewer workers. But they hire fewer managers to oversee them, and tasks and responsibilities shift within the firm. Turnover increases for all types of workers, but middle-skilled workers appear to fare worse than both their high and low skilled counterparts.
Are these the droids we’re looking for?
The paucity of suitable data makes it difficult to study the impact of robots on the economy. Ambiguity over what machines should be considered robots is part of the problem. Roboticists characterize them as machines that are able to sense changes in their environment and autonomously formulate complex responses. According to the International Federation of Robotics (IFR), a global association of national robotics industry associations, there are two types of robots its affiliated firms sell commercially: industrial and service. Industrial robots are “automatically controlled, re-programmable, multi-purpose manipulator[s] programmable in three or more axes, which can be either fixed in place or mobile for use in industrial applications”. (IFR Statistical Department, 2017a, p. 25) Service robots are “actuated mechanism[s] programmable in two or more axes with a degree of autonomy, moving within [their] environment, to perform intended tasks”. (IFR Statistical Department, 2017b, p.10) In simple terms, industrial robots are overwhelmingly computer controlled arms fitted with sensors to sense and attachments to manipulate the physical world; service robots are mostly vehicle-like machines that can navigate their environment partly or completely on their own.
The domestic Canadian robotics industry focusses on programming and integration of robotic hardware which Canada imports from IFR-affiliated firms located primarily in countries like Japan, Germany, and the United States. The IFR publishes aggregate data on these firms’ annual shipments by country, industry and task, but they offer little Canada-specific detail.Note To fill this gap, Dixon (2020) describes at length how import data collected by the Canadian Border Services Agency (CBSA) can be used to track shipments by IFR-affiliated firms after they cross the Canadian border. The resulting Robots! dataset offers a comprehensive record of Canadian firms’ robotic hardware purchases over the last two decades.
A big advantage of Robots! over other potential sources is that Canada’s robot importers are identified by business number. Of the 3,085 businesses importing robot hardware, over half appear to be using them in production. These firms can be found in other Statistics Canada data, and the combined data can be used to gain insights on what type of firms use robots, and how their behaviour changes afterwards.Note Dixon, Hong and Wu (henceforth DHW, forthcoming) use the National Accounts Longitudinal Microdata File (NALMF) for all firms over the 2000-2016 period and more detailed information available in the Workplace and Employee Survey (WES) for select firms in the years 2001-2006 to explore what robots have been doing in the Canadian economy.
Robots in the Canadian Economy
By matching business numbers from the Robots! and the NALMF data, Dixon (2020) characterizes the firms by industry and geography. Chart 1 shows that the individual sector with the largest stock of robots in Canada over most of the period covered by the data is the automotive sector.Note The result is unsurprising: the global auto industry is the most enthusiastic investor in robots, and is still the most prominent user worldwide. Canadian robot stocks in the sector grew sharply between 2000 and 2008, but investment dropped precipitously in the wake of the global financial crisis and stocks have been roughly flat since then.

Data table for Chart 1
| Robots for automotive assembly lines | Industrial robots | |
|---|---|---|
| CAN$ millions | ||
| 1996 | 17.9 | 18.9 |
| 1997 | 49.6 | 98.5 |
| 1998 | 105.9 | 151.9 |
| 1999 | 152.1 | 227.5 |
| 2000 | 182.5 | 307.7 |
| 2001 | 208.0 | 354.0 |
| 2002 | 250.0 | 419.6 |
| 2003 | 388.0 | 470.0 |
| 2004 | 391.4 | 526.0 |
| 2005 | 484.3 | 582.4 |
| 2006 | 466.1 | 608.0 |
| 2007 | 525.5 | 624.8 |
| 2008 | 560.1 | 651.1 |
| 2009 | 520.2 | 648.5 |
| 2010 | 502.5 | 651.0 |
| 2011 | 486.7 | 690.9 |
| 2012 | 462.5 | 712.3 |
| 2013 | 432.8 | 749.1 |
| 2014 | 408.2 | 794.2 |
| 2015 | 381.9 | 859.8 |
| 2016 | 365.8 | 972.8 |
| 2017 | 365.4 | 1060.5 |
|
Note: Robot stocks calculated based on 12-year useful life suggested by the International Federation of Robotics. Source: Statistics Canada, import data. |
||
Chart 2 shows that robot use in other manufacturing industries has expanded especially after 2012, led by machinery manufacturing (NAICS 333), plastics and rubber (NAICS 326), primary and fabricated metal manufacturing (NAICS 331 and 332) electrical/electronics (NAICS 335) industries.
Outside of manufacturing, Chart 3 shows that there has been robotics investment in other goods (including agriculture, mining, utilities and construction) and services. The largest single service sector with robotic investment has been healthcare sector. The exact nature of this automation is unclear, although some of it almost certainly includes laboratory automation (including pipetting robots and laptop robot arms) in medical diagnostics. The robots going into other parts of the healthcare sector are more difficult to characterize, but investment in them seems to be significant.

Data table for Chart 2
| Automotive | Petroleum and plastics | Minerals and metals | Machinery | Computers and electronics | Other manufacturing | |
|---|---|---|---|---|---|---|
| CAN$ millions | ||||||
| 2000 | 70.8 | 11.4 | 25.5 | 197.7 | 13.9 | 6.0 |
| 2007 | 307.8 | 30.1 | 85.0 | 379.5 | 33.0 | 30.0 |
| 2015 | 235.4 | 46.6 | 81.8 | 426.7 | 47.3 | 39.4 |
| 2017 | 225.3 | 55.2 | 88.0 | 516.4 | 47.3 | 43.2 |
|
Note: Robot stocks calculated based on 12-year useful life suggested by the International Federation of Robotics. Sources: Statistics Canada, Import Data and National Accounts Longitudinal Microdata File. |
||||||

Data table for Chart 3
| Other goods | Other services | Healthcare | |
|---|---|---|---|
| CAN$ millions | |||
| 2000 | 2.7 | 77.0 | 0.9 |
| 2007 | 5.3 | 115.3 | 3.1 |
| 2015 | 16.5 | 108.4 | 2.6 |
| 2017 | 26.3 | 117.5 | 2.5 |
|
Note: Robot stocks calculated based on 12-year useful life suggested by the International Federation of Robotics. Sources: Statistics Canada, Import Data and National Accounts Longitudinal Microdata File. |
|||
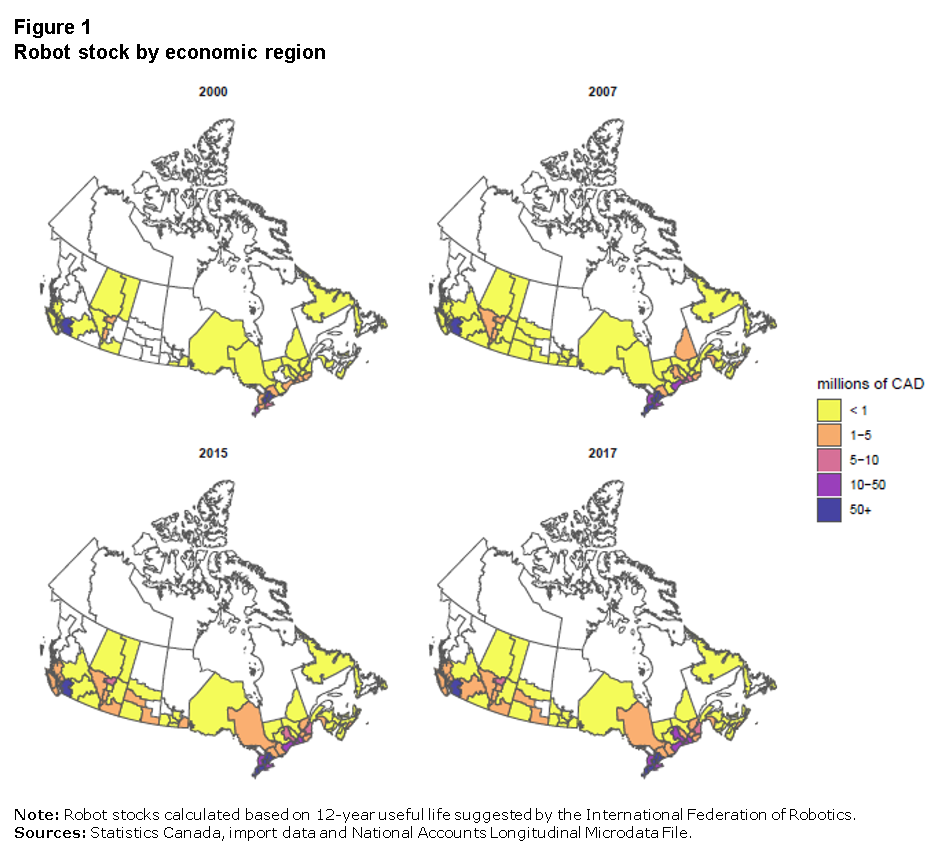
Figure 1 shows the geographical distribution of robots in selected years. The addresses of importing firms, including intermediaries, are used to assign robots to approximate economic regions within Canada. The maps show that robots have been spreading across Canada, with almost all provinces and most intra-provincial regions adopting some industrial robots by 2017. Much of the value is concentrated in Canada’s major cities (Vancouver, Toronto and Montreal), and also the industrial areas around Windsor and Hamilton that are home to Canada’s automotive sector.Note Outside of Canada’s three largest cites, robots have proliferated especially across the Prairies. Both Alberta and Saskatchewan have experienced relative increases in robot intensity over time.
Description for Figure 1
The title of Figure 1 is “Robot stock by economic region.”
The figure consists of four maps of Canada arranged in two columns. The top right map is marked 2000, the top left is marked 2007, the bottom right is marked 2015 and the bottom left is marked 2017. Each map has lines dividing 13 provinces/territories, and lines within the 10 provinces denoting sub-provincial economic regions.
A legend to the right of the four maps has five colours associated with stocks of robots, in millions of Canadian dollars. Less than 1 million is marked by yellow, 1 to 5 million is orange, 5 to 10 million is pink, 10 to 50 million is purple, and over 50 million is blue.
The maps represent the geographic spread of robot adoption. In all four maps, the three territories, the four northernmost British Columbia territories, northern Saskatchewan and Manitoba, and the two northernmost Quebec territories, the tip of the Gaspé Peninsula and the two central regions of Newfoundland and Labrador are white, indicating negligible robot stocks in any of these regions for years. At the other extreme, the lower mainland of British Columbia, around the Greater Vancouver Area, and Greater Toronto Area are blue (more than 50 million Canadian dollars) in all four maps.
In the first map, marked year 2000, Edmonton and Calgary and the areas in Quebec south of the St. Lawrence, around Montreal and Laval are orange (from 1 million to 5 million Canadian dollars). The areas south of Toronto are a mixture of purple (from 10 million to 50 million Canadian dollars) and orange. Vancouver Island and the Okanagan in the British Columbia interior, all of Alberta except for the area west of Edmonton and Calgary, the southeast corner of Manitoba, most of Ontario, most of the northern part of the St. Lawrence Valley in Quebec, the southern halves of the Maritimes, and the east and west coasts of Newfoundland are yellow (less than 1 million Canadian dollars). The rest of British Columbia, all of Saskatchewan, the bulk of Manitoba, the northern part of Quebec and the northern part of the Maritimes are white.
In the second map, marked year 2007, the yellow portions (less than 1 million Canadian dollars) have spread to cover the entire southern interior of British Columbia apart the lower mainland, which is blue (over 50 million Canadian dollars), all of Alberta except for Edmonton, Calgary, and the Rocky Mountains, which are orange (1 million to 5 million Canadian dollars). The southern half of Saskatchewan except for a portion along Manitoba have turned from white to yellow, as have the southern portion of Manitoba. The areas in south of Toronto have gone from a mixture of orange and purple to purple (from 10 million to 50 million Canadian dollars) and blue (over 50 million Canadian dollars). Montreal has turned purple, and areas of southern Quebec and the Maritimes are a mixture yellow and orange. The rest of the map is unchanged.
In the third map, marked year 2015, Vancouver Island has gone from yellow to orange (1 million to 5 million Canadian dollars). The southwest corner of Alberta and Calgary are orange. The rest of Alberta is yellow, except for Edmonton, which has changed from orange to purple (10 million to 50 million Canadian dollars). The middle portion of Saskatchewan along the Alberta border and the southeast region have turned orange. The southeast region of Manitoba has turned from yellow to orange, while the other parts of the south portion remains yellow (less than 1 million Canadian dollars) and the northern part of the province remains white. The northeast area of Ontario has turned orange, and some of the yellow north of Toronto has turned orange and the orange has turned purple.
The western part of the fourth map, in the bottom right corner, marked year 2017, is nearly identical to that of the third map, but the area of Red Deer between purple Edmonton orange Calgary has gone from yellow to orange (1 million to 5 million Canadian dollars). The yellow has spread somewhat north in Manitoba along the Alberta border, but southeast corner of Manitoba has returned to yellow (less than 1 million Canadian dollars) from the orange of the 2015 map. The rest of the map is unchanged.
The note and sources appearing at the bottom of Figure 1 are as follows:
Note: Robot stocks calculated based on 12-year useful life suggested by the International Federation of Robotics.
Sources: Statistics Canada, import data and National Accounts Longitudinal Microdata File.
Why, Robots!?
Dixon, Hong and Wu (forthcoming) use Robots! along with NALMF and WES data to explore how firms’ robot adoption affects them and the people working for them. It finds that firms that adopt robots experience increases in multi-factor productivity.Note Using the more detailed information in the Worker Employer Survey (WES), DHW find that these productivity increases are associated with organizational changes within the firm. But these organizational changes do not involve shedding workers overall: Chart 4 shows that they are associated with unconditional increases in employment of almost 20% on average after the robots arrive.
DHW control for various other factors that could influence firms’ employment such as investment in other machinery and equipment (M&E) and information and communications technology (ICT), exposure (or lack thereof) to import competition, and previous revenue growth. They also use matching methods and instrumental variables to control for unobservable differences between robot and non-robot adopters. Even after controlling for other factors, they find that firms in every robot-using industry increases total employment on average.

Data table for Chart 4
| Years before/after robot adoption | Change in employees |
|---|---|
| index | |
| -5 | 1.08 |
| -4 | 1.06 |
| -3 | 1.07 |
| -2 | 1.07 |
| -1 | 1.06 |
| 0 | 1.17 |
| 1 | 1.22 |
| 2 | 1.21 |
| 3 | 1.23 |
| 4 | 1.21 |
| 5 | 1.21 |
|
Note: Robot stocks calculated based on 12-year useful life suggested by the International Federation of Robotics. Sources: Statistics Canada, import data and Workplace and Employee Survey. |
|
Although employment increases overall, robots do cause turnover within firms for all types of workers, and the composition of the workforce changes. DHW find from the WES that surveyed firms over the 2001-2006 period were more likely to reduce employment among middle skilled workers, while increasing both high and low skilled employment. While some of the tasks robots commonly perform, such as placing, packaging and palletizing, have commonly been performed by low-skilled manual labour, many of them involve a degree of skill. For example, operating machine tools or preparing laboratory samples for testing have involved operators or lab technicians with vocational training, and robots may be displacing them.
The most negatively affected workers, however, appear to be managers. The turnover at the management level increases, but as Chart 5 shows, fewer managers are promoted or hired to replace the ones that leave.Note DHW find that after controlling for observable and unobservable factors, both the number and fraction of employees that are managers fall when robots are adopted.

Data table for Chart 5
| Non-robot adopters | Robot adopters | |
|---|---|---|
| index | ||
| 2001 | 1.00 | 1.00 |
| 2002 | 0.90 | 0.69 |
| 2003 | 1.00 | 0.53 |
| 2004 | 0.96 | 0.50 |
| 2005 | 0.95 | 0.50 |
| 2006 | 0.95 | 0.53 |
|
Note: Robot stocks calculated based on 12-year useful life suggested by the International Federation of Robotics. Sources: Statistics Canada, import data and Workplace and Employee Survey. |
||
The decline in the number of managers are associated with an increase in the span of control, a reallocation of decision rights, and a change of incentives within the firm. Individual managers report supervising more people after robot adoption, and firms report a reduction in the number of layers between headquarters and the shop floor. Some typical managerial responsibilities, such as worker training are moved closer to the factory floor, while others, like choice of production technologies are moved to business owners or to the corporate head office. Finally, compensation systems appear to make greater use of individual incentive pay after robots arrive.
DHW suggest two possible reasons for why firms change the way they are organized upon adopting robots. One possibility is that robots, in addition to operating with consistent precision, allow for more precise measurement of outcomes. Firms that invest in robots are more likely to report that product quality is a strategic priority, and that measuring performance is an important priority. Because monitoring quality and performance are common managers’ tasks, firms need fewer of them once the robots arrive. The greater use of individual incentives goes hand in hand with an increasing ability to attribute outcomes like quality to individual performance.
Another possibility is that robots allow firms to be more flexible. One of the main advantages of robots compared to other machines is that they can be reconfigured for new varieties or different tasks quickly and inexpensively. Firms that use nimbleness as a market strategy also need workers who are able to switch easily between tasks. In addition to being given more decision-making authority, workers at firms with robots report that their schedules become less predictable. These results are consistent with firms needing workers capable of performing a greater variety of less routine tasks.
Conclusion
Recent improvements in robotics have rekindled ancient fears about the impact of robotics on humankind. Unfortunately, existing data seldom distinguishes robots from other types of automation, so research into their impact so far has been difficult. This article introduces research from a new Statistics Canada dataset, Robots!, on the impact of robots at the firm-level.
The research suggests that some of the worst fears, like a robocalypse for labour, are not evident in the data. Firms hire more, not fewer, workers after investing in robots. However, they do appear to need different types of workers. The workers they hire tend to have either higher or lower skills than the ones that leave the firm. The workers are given greater decision-making authority and greater individual incentives, but their work with or alongside robots becomes less routine.
Managers, on the other hand, appear not to fare as well when robots arrive. Robot-adopting firms use fewer layers of management, more managers leave and fewer of them are hired. The changes in firm organization could be associated with features of robots that allow for more precise measurement, and also more flexibility on the part of the firm.
References
Acemoglu, D., and P. Restrepo. 2020. “Robots and jobs: Evidence from US labor markets.” Journal of Political Economy 128 (6): 2188–2244.
Autor, D.H., and A. Salomons. 2017. Robocalypse Now: Does Productivity Growth Threaten Employment? Paper presented at the National Bureau of Economic Research’s Conference on Artificial Intelligence. Toronto, September 13-14, 2017.
Dixon, J. 2020. How to Build a Robots! Database. Analytical Studies: Methods and References, no. 028. Statistics Canada Catalogue no. 11-633-X. Ottawa: Statistics Canada.
Dixon J., B. Hong, and L. Wu. Forthcoming. “The Employment Consequences of Robots: Firm-level Evidence.” Management Science.
IFR (International Federation of Robots) Statistical Department. 2017a. World robotics: Industrial robots 2016.
IFR (International Federation of Robots) Statistical Department. 2017b. World robotics: Service robots 2016.
- Date modified: