
Publications
Aboriginal Peoples Survey, 2012
The Education and Employment Experiences of First Nations People Living Off Reserve, Inuit, and Métis: Selected Findings from the 2012 Aboriginal Peoples Survey
Part B: The education and employment experiences of Inuit

Archived Content
Information identified as archived is provided for reference, research or recordkeeping purposes. It is not subject to the Government of Canada Web Standards and has not been altered or updated since it was archived. Please "contact us" to request a format other than those available.
- Section 1: Education pathways
- Section 2: Experiences during last year of school
- Section 3: Postsecondary education experiences
- Section 4: Current employment experiences
- Section 5: Further education or training
- Notes
Inuit in Canada have a unique culture, core knowledge and beliefs (Inuit Tapiriit Kanatami, 2013). They have a homeland that covers almost one third of Canada, from eastern Yukon to the North tip of Ellesmere Island to the eastern coast of Labrador. According to data from the 2011 National Household Survey (NHS), 59,445 people identified as Inuit. They represented 4.2% of the total Aboriginal population and 0.2% of the total Canadian population. Almost three-quarters of Inuit in Canada lived in Inuit Nunangat, which stretches from Labrador to the Northwest Territories and comprises four regions: Nunatsiavut, Nunavik, Nunavut and the Inuvialuit Settlement Region.1
The analyses that follow examine the education and employment experiences of Inuit who, at the time of the Aboriginal Peoples Survey (APS), were aged 18 to 44 and were not attending elementary or high school.
Section 1: Education pathways
Attending high school is the most common means of acquiring a secondary diploma in Canada, but youth can follow different pathways through the education system. Some enter and stay until they graduate, while others drop out. Those who drop out may re-enrol and earn a high school diploma or drop out more than once. Some who leave school before graduation may obtain an equivalency diploma by enrolling in classes offered through adult high schools, community colleges, or distance education programs.
This section looks at the education pathways of Inuit completers and leavers aged 18 to 44. Completers are profiled in terms of variables such as age of completion, path to completion (high school versus equivalency program), and reasons for returning for those with a break in attendance. For leavers, age when last attended school, occurrences of dropping out and reasons for doing so, and current attendance at an equivalency program are examined.
It is important to recognize that some leavers may return to school in the future and obtain high school credentials. Moreover, high school graduation may not be the highest level of educational attainment of either completers or leavers, as some may also have a trades certificate, college diploma, or university degree. Postsecondary credentials are discussed in Section 3.
1. Completers
About four in ten (42%) Inuit aged 18 to 44 had completed the requirements for a high school diploma or equivalent in 2012. This group is hereafter referred to as “completers.” Women were more likely than men to have such credentials (46% versus 36%). Data from the NHS show that 89% of the non-Aboriginal population aged 18 to 44 had at least a high school diploma or equivalent in 2011.
Average age at high school completion
With the exception of Quebec,2 the typical student graduates from high school at age 18 (McMullen and Gilmore, 2010). According to the APS, the average age at which Inuit completers obtained high school credentials was 18.3 years. Those who completed an equivalency program (and hence, followed an indirect path to high school completion) were older (19.8) when they earned their high school diploma than were those who graduated from a high school (18.1). This was true for both men and women.
Majority obtained diploma through high school
The majority (85%) of Inuit completers obtained their high school diploma through attendance at a high school. There were no significant differences by gender.
About four in 10 (42%) who obtained a high school diploma through an equivalency program did so at an adult high school. An additional 31%E attended a community centre, and 17%E completed the requirements at a college or technical institute.
The majority (85%) of Inuit completers followed a direct path through school. One in ten left once, and 5%, more than once. The percentages of men and women who completed high school without any breaks in attendance did not differ significantly: 87% and 84%, respectively.
Inuit completers with a break in school attendance were asked their main reason for returning. The majority (70%) returned because they “realized value of education/wanted a diploma.”
2. Leavers
In 2012, 58% of Inuit aged 18 to 44 had not completed the requirements for a high school diploma or equivalent. This group is hereafter referred to as “leavers.” Data from the 2011 National Household Survey show that the corresponding figure for the non-Aboriginal population was 11%.
Age when last attended school
Inuit leavers were, on average, 17.1 years old when they last attended school. No significant difference was found for male and female leavers.
While the majority (66%) of Inuit leavers dropped out once, 34% dropped out at least twice. Female leavers were more likely than male leavers to have dropped out multiple times: 40% versus 28%.
Men and women drop out for different reasons
Research has shown that reasons for dropping out of school differ by gender. Data from the 2002 Youth in Transition Survey found students of both genders cited school-related reasons most frequently, but females were much more likely to report personal or family reasons, and males more often reported work-related factors (Bushnik, Barr-Telford and Bussière, 2004).
Respondents to the 2012 APS who dropped out were asked why they left school before completion. If they offered more than one reason, they were asked the “main” reason. Those who dropped out more than once were asked about their most recent departure.
According to the 2012 APS, the reasons that Inuit male leavers dropped out of school included the following: school problems3 (22%), lack of interest (15%), and wanted to work (11%). Female leavers’ main reason for dropping out was pregnancy/need to care for their own children - 38%.
Few leavers attending equivalency program
At the time of the APS, 5%E of Inuit leavers were attending a high school equivalency program. The percentages for male and female leavers did not differ significantly: 3%E and 8%E, respectively. More than half of them (52%E) were enrolled at an adult high school.
Section 2: Experiences during last year of school
Why some students leave high school before they graduate, while others go on to earn a diploma is not easy to explain. The previous section examined specific reasons for leaving school, which can be viewed as the “proximal” reasons that immediately preceded departure. However, dropping out is not an isolated event that can be attributed to a single cause, but rather, a complex process that is influenced by factors associated with students, their families, the schools they attend, and their communities, the effects of which can begin to emerge in the early years of school attendance (see Rumberger 2011 for a review of the general population literature).
Data from the National Household Survey (NHS) show that in 2011, a larger share of Inuit had not completed high school, compared with the non-Aboriginal population (Statistics Canada, 2013a). The 2012 APS collected data on factors that might be associated with completing or withdrawing from high school. These factors, while not exhaustive, cover a range of experiences and circumstances that are important from an Aboriginal perspective - at home, in school, and in the community (Canadian Council on Learning, 2009).
This section describes how Inuit aged 18 to 44 perceived their experiences during their last year of school. It is organized into three subsections. The first describes personal factors that may be associated with completing or leaving high school. The second subsection describes family experiences and support. The third examines the school environment. The guiding research question was, “Do the personal, family, and school-related experiences of high school completers and leavers differ?”
The topics analyzed in this section are based on respondents’ recollections, and therefore, may be subject to recall error. Moreover, differences between completers and leavers do not reflect simple “cause-and-effect” relationships with high school graduation; rather, the findings should be interpreted as being “associated with” being a completer or leaver.
1. Personal experiences
This section explores some aspects of personal lives that are known to be associated with graduating from, or dropping out of, high school. The 2012 APS included the following measures of respondents’ personal experiences during their last year in school: educational performance (grades and repeating a grade), student engagement (absenteeism, participation in extracurricular activities, and employment during high school), peers, and changing schools.
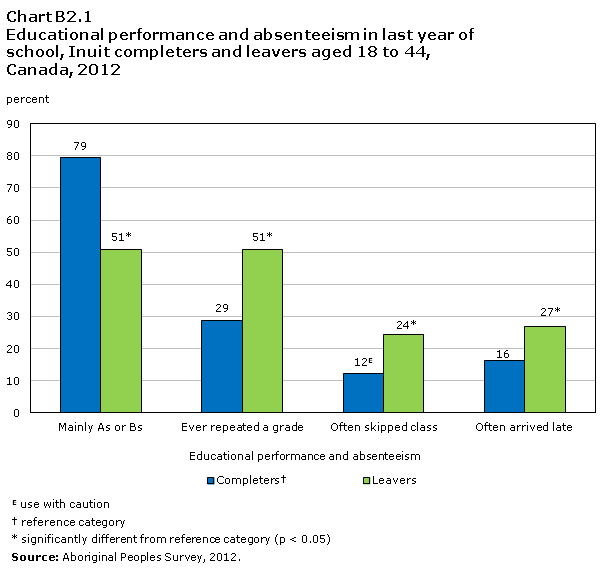
Completers more likely to have good grades
Respondents to the 2012 APS were asked about their overall grade average in their last year of school. Inuit completers were more likely than leavers to report mainly As (36% versus 20%) or Bs (43% versus 31%) (Chart B2.1). Conversely, leavers were more likely than completers to report mainly Cs (29% versus 18%) or mainly Ds, Es, and Fs (20% versus 3%E).
Leavers were more likely than completers to have ever repeated a grade during their elementary or high school years (51% versus 29%) (Chart B2.1). Male leavers were especially likely to have repeated a grade - 57%, compared with 45% of female leavers, 30% of male completers, and 28% of female completers.
Skipping classes/Arriving late
Absenteeism behaviours such as skipping classes and arriving late are indicators of school disengagement, which is related to dropping out (Rumberger, 2011). Respondents to the 2012 APS were asked how often they skipped classes (without parents’ permission) and arrived late during their last year of school. Inuit completers were less likely than leavers to report that they “often” skipped classes (12%E versus 24%) or that that they “often” arrived late (16% versus 27%) (Chart B2.1).
Extracurricular activities
Participation in extracurricular activities is an indicator of student engagement outside of school hours. Students who participate in extracurricular activities, especially males involved in sports, are less likely to drop out (Rumberger, 2011). Respondents to the 2012 APS were asked if they participated in any of the following out-of-school activities during their last year of school: a sport or a physical activity or playing organized sports (including taking lessons); an art, drama or music group or club (including taking lessons); a school group or club (such as student council, yearbook or science club) or groups or clubs outside of school; activities related to First Nations, Métis or Inuit culture; spending time with Elders; and volunteering or helping without pay in the community.
Inuit completers were more likely than leavers to have participated in a school group or club (24% versus 15%) and to have volunteered (36% versus 27%) at least once a week in their last school year (Chart B2.2). Leavers were more likely than completers to have participated in cultural activities (36% versus 22%). The percentages of completers and leavers who participated in sport- (62% and 60%) and art- (28% and 30%) related activities and who were involved with Elders (38% and 46%) did not differ significantly.
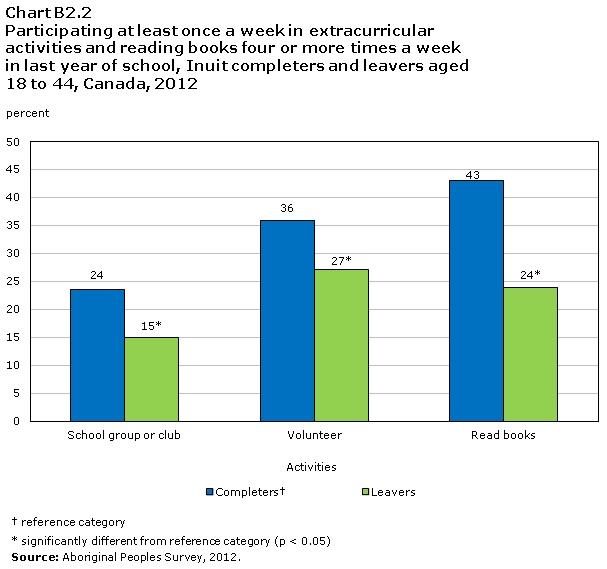
Completers read books more often
Analyses of data from the Program for International Student Assessment and the Youth in Transition Survey (YITS) have shown that students who dropped out of high school by age 19 had lower reading abilities at age 15 (Knighton and Bussière, 2006). The 2012 APS asked respondents how often they read or looked at books, magazines, comics, etc. outside of school hours in their last year of school. Inuit completers were more likely than leavers to report that they read books four or more times a week (43% versus 24%) (Chart B2.2).
Completers more likely to work 1 to 3 times a week
Working while attending high school is not necessarily detrimental to academic outcomes. According to results of the YITS, high school students who worked less than 20 hours a week were less likely to drop out than were those who did not work at all or who worked 30 or more hours a week (Bushnik, 2003). The 2012 APS asked respondents if they worked at a job (such as babysitting, working at a store, or tutoring) during their last year of school, and if so, how many times a week.
A higher percentage of Inuit completers than leavers reported working at a job 1 to 3 times a week during their last year of school (29% versus 17%). Leavers were more likely than completers to not work or to work less than once a week (56% versus 38%). The percentages of completers and leavers who worked 4 or more times a week did not differ significantly (33% and 27%) (Chart B2.3).
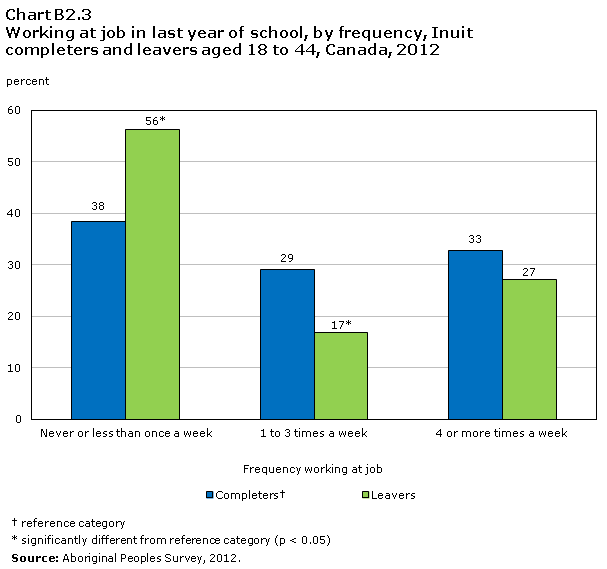
Female completers were the most likely to have worked 1 to 3 times a week during their last year of school - 36%, compared with 19% of male completers, 18% of female leavers, and 15% of male leavers.
Friends with risk behaviours
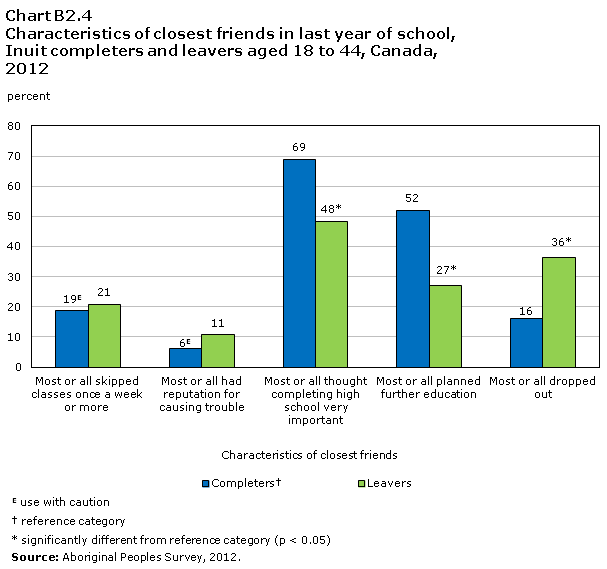
Having friends who engage in risk behaviours or who have dropped out have been shown to increase the odds that an individual will also leave school (Rumberger, 2011). APS respondents were asked how many of their closest friends during their last year of school skipped classes once a week or more; had a reputation for causing trouble; and smoked cigarettes, used drugs, and drank alcohol. Together, these questions can provide a profile of the number of friends with “risk behaviours.”
Inuit had mixed recollections about the risk behaviours of their friends. The percentages of completers and leavers reporting that “most” or “all” of their closest friends skipped classes once a week or more (19%E and 21%), had a reputation for causing trouble (6%E and 11%), and used drugs (16% and 18%) did not differ significantly (Chart B2.4). However, while Inuit leavers were more likely than completers to report that “most” or “all” of their closest friends smoked cigarettes (64% versus 53%), Inuit completers were more likely than leavers to report that “most” or “all” of their closest friends drank alcohol (35% versus 22%).
Friends with high education aspirations
APS respondents were asked how many of their closest friends during their last year of school thought completing high school was very important; were planning to further their education after high school; thought it was okay to work hard at school; and had dropped out. Together, these questions can provide a profile of the number of friends with “high education aspirations.”
Inuit completers were more likely than leavers to report that “most” or “all” of their closest friends had high education aspirations. For example, 69% of completers, compared with 48% of leavers, had many close friends who thought completing high school was very important. Similarly, 52% of completers versus 27% of leavers had many close friends who planned education beyond high school. Conversely, 36% of leavers reported that “most” or “all” of their closest friends had dropped out, compared with 16% of completers (Chart B2.4). The percentages of completers and leavers with many friends who thought it was okay to work hard at school did not differ significantly (59% and 52%).
Support from friends
Respondents were asked if they needed support for personal problems, career choices, course schedules, or anything else during their last year in school. Among Inuit who said they had needed such support, 62% reported having received it from their friends. The percentages of completers and leavers who had received support from their friends did not differ significantly (58% and 66%).
Completers more likely to change schools frequently
Frequent school changes tend to increase the odds of dropping out. In a British Columbia study, Aman and Ungerleider (2008) reported that graduation rates were highest among Aboriginal4 students who never changed high schools. They also found that school changes due to regular grade progression (for example, from a middle school to a senior high school) did not affect completion rates, but school changes for other reasons (for example, residential moves) were associated with lower completion rates. This observation is especially relevant to education in Inuit Nunangat, where frequent school changes may be part of regular grade progression because of a lack of schools in some areas. In fact, school mobility may have a different meaning for Inuit students than for other populations. The 2012 APS offers a unique opportunity to look at the relationship between school mobility and graduation among the Inuit.
APS respondents were asked how many schools they attended from preschool through Grade 6. Inuit completers were more likely than leavers to have changed schools frequently during their elementary school years: 25% versus 12% reported they had attended three or more elementary schools.
Respondents were also asked how many schools they attended starting in Grade 7. Again, Inuit completers were more likely than leavers to have changed schools frequently - 32% of completers had attended two schools during their high school years, and 15% had attended three or more. By contrast, 18% of leavers had attended two schools, and 6% had attended three or more.
Those who had attended more than one elementary or high school were asked the reason for the last change. “Regular progression through the school system” was the top reason for completers (63%) and leavers (70%). “Family moved” was the second most-cited reason (25% of completers and 16% of leavers).
2. Family-related experiences
The many personal factors that are associated with school outcomes are shaped by the different contexts in which students spend their time. The family is a key context that can influence students and their academic achievement. The 2012 APS collected information on family support during respondents’ last year of school.
Family involvement in school
Respondents were asked if their parents, guardians or other family members did the following during their last year of school: speak to or visit their teachers; attend a school event in which they participated; and participate in any other school activity. Inuit completers and leavers did not differ significantly in reporting family involvement at school. For example, a majority of completers and leavers reported that their parents spoke to or visited their teacher during their last year of school (69% and 63%).
Help with homework
Respondents were asked how often their parents, guardians or other family members checked or helped with homework in their last year of school. The percentages of Inuit completers and leavers who received help with their homework did not differ significantly. For instance, 33% of completers and 29% of leavers reported that their parents checked their homework at least once a week.
Support from family
The 2012 APS asked if at any time during respondents’ last year in school they needed support for personal problems, career choices, course schedules, or anything else. Among Inuit who needed such support, 69% reported having received it from their parents, guardians, or other family members. The percentages of Inuit completers and leavers who received support from their family did not differ significantly (71% and 68%).
Majority lived with family
The 2012 APS asked respondents if they lived with a parent, guardian or other family members during their last year of school. The majority of Inuit completers and leavers lived full-time with their family during their last year of school (81% and 79%).
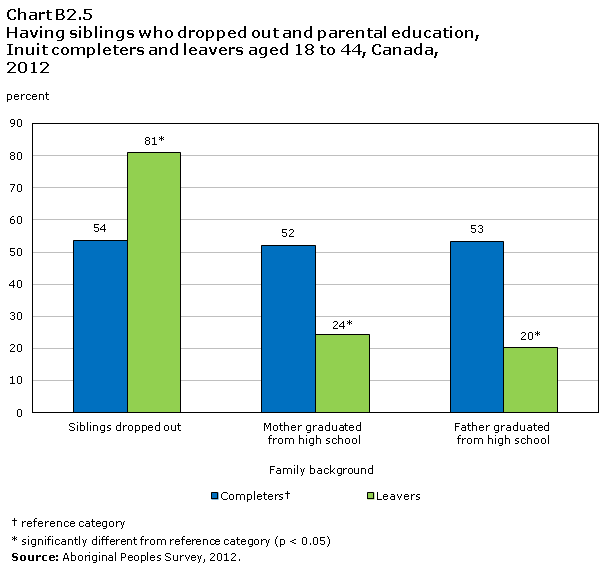
Siblings who dropped out
Students with a sibling who leaves school before completion are more likely to drop out themselves (Rumberger, 2011). The 2012 APS asked respondents if any of their brothers or sisters had dropped out of high school. Eight out of ten (81%) Inuit leavers had siblings who had dropped out. This percentage was higher than the figure for completers (54%) (Chart B2.5).
Parents who graduated from high school
Parents’ education is a “human resource” that can influence children’s cognitive development, motivation, and educational aspirations (Rumberger, 2011). Respondents were asked about the highest level of education that their mother and father had completed. Inuit completers were more likely than leavers to have parents with at least a high school diploma (Chart B2.5).
3. School-related experiences
Along with the family, the school itself can influence students and their academic success. A school’s policies and practices can create a climate that may promote or hinder student engagement and achievement.
School environment
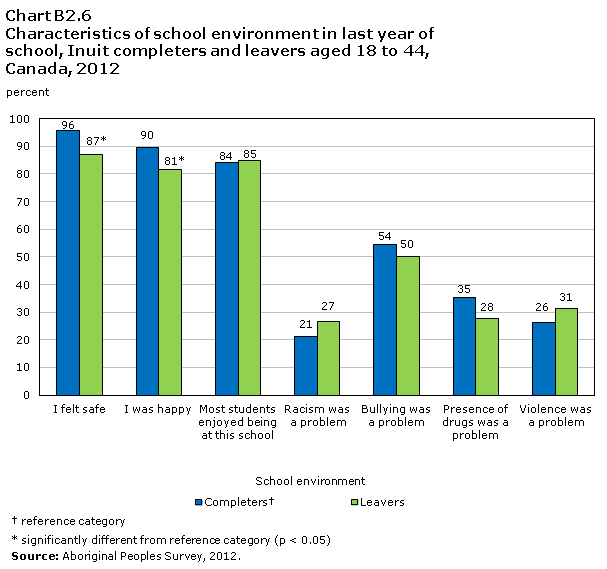
The 2012 APS asked respondents if, during their last year of school, they felt safe and happy at school; if most students at the school enjoyed being there; and if the school offered parents many opportunities to be involved in school activities. Together, these questions constitute a “positive school environment” indicator. Inuit completers were more likely than leavers to have felt safe (96% versus 87%) and happy (90% versus 81%) at their school. The percentages of Inuit completers and leavers who reported that most students enjoyed being there (84% and 85%) and that the school offered parents many opportunities to be involved (69% and 71%) did not differ significantly (Chart B2.6).
Respondents were asked if racism, bullying, alcohol, drugs or violence were problems at school during their last year. Together, these questions constitute a “negative school environment” indicator. Inuit completers and leavers did not differ in their perceptions about the negativity of their school environment. The percentages of completers and leavers who reported that racism (21% and 27%), bullying (54% and 50%), alcohol (20% and 17%), drugs (35% and 28%), and violence (26% and 31%) were problems at their school did not differ significantly (Chart B2.6).
School support
The 2012 APS asked respondents if their school supported First Nations, Métis, or Inuit culture (through teaching or activities) during their last year. Inuit leavers were more likely than completers to report that the school supported their culture: 82% versus 71%.
Respondents were also asked if at any time during their last year in school they needed support for personal problems, career choices, course schedules, or anything else. Among Inuit who needed such support, 77% received it from teachers, guidance counsellors, or others at school. Completers were more likely than leavers to report having received support from school staff: 87% versus 68%.
Section 3: Postsecondary education experiences
In recent years, growing percentages of Inuit have earned postsecondary credentials (CESC, 2007; Statistics Canada, 2008). Data from 2011 from the National Household Survey (NHS) show no gap between the Inuit and the non-Aboriginal population in attainment rates at the trades level. However, gaps remain at the college and university levels (Statistics Canada, 2013a). Barriers to completion of postsecondary education for Inuit may include lack of academic preparation, the need to relocate (often from remote to urban areas), lack of financial resources, family responsibilities, and loss of support systems (Malatest et al, 2004; Holmes, 2005).
This section describes the experiences of Inuit in obtaining postsecondary credentials.5 Because some high school leavers pursued postsecondary studies, comparisons between leavers and completers are made when appropriate.
The first subsection is a postsecondary education profile of Inuit aged 18 to 44.6 The second focuses on those with postsecondary credentials (trades certificate, college diploma, university certificate below the bachelor’s level, university degree). The third subsection concerns those who started but never finished postsecondary education.
1. Postsecondary education profile
A quarter with postsecondary credentials
At the time of the 2012 APS, 26% of Inuit aged 18 to 44 had postsecondary credentials; according to the 2011 NHS, the comparable figure for the non-Aboriginal population in the same age range was 64%. An additional 5%E of Inuit were attending a postsecondary institution for the first time; 9% had started postsecondary studies but did not finish; and 61% had never attended a postsecondary institution.
The postsecondary education profiles of Inuit men and women were similar, but differences by age group were apparent. As expected given their age, those aged 18 to 24 were less likely than 25- to 44-year-olds to have completed postsecondary education (9% versus 34%), but more likely to be attending a postsecondary institution for the first time (9%E versus 2%E).
About one in eight leavers have postsecondary credentials
More than four in ten (45%) Inuit high school completers had postsecondary credentials. This percentage was much smaller for leavers but nonetheless, 12% of high school leavers were postsecondary graduates. Completers were also more likely than leavers to be currently attending a postsecondary institution for the first time (8%E versus 2%E). The percentages of Inuit completers and leavers who had started but never finished postsecondary studies did not differ significantly (Chart B3.1).

2. Postsecondary graduates
Among Inuit aged 18 to 44 who were postsecondary graduates, close to half (48%) graduated with a college diploma (17% graduated from a program of less than one year; 24%, from a one- or two-year program; and 7%E, from a program of more than two years). A third (32%) had a trades certificate, and 15%E, a university degree. Men were more likely than women to have a trades certificate (50% versus 18%E).
According to the 2011 NHS, the comparable figures for non-Aboriginal postsecondary graduates aged 18 to 44 were 34% for college diplomas, 16% for trades certificates, and 43% for university degrees.
Majority of leavers had trades certificate
Inuit high school completers and leavers with postsecondary credentials tended to have graduated from different types of programs. Among completers, the most common credentials were a college diploma from a one- or two-year program (27%), a trades certificate (22%), a university degree (19%E), a college diploma from a program of less than one year (18%), and a college diploma from a program of more than two years (8%E). The majority of high school leavers with postsecondary credentials had a trades certificate (62%); 17%E had a college diploma from a program of less than one year, and 15%E had a college diploma from a one- or two-year program.
Half moved for postsecondary studies
Because there are no colleges or universities located within Inuit Nunangat, Inuit usually have to relocate to undertake postsecondary studies (Inuit Tapiriit Kanatami, 2007). Data from the 2012 APS show that 50% of Inuit with postsecondary credentials had moved to pursue their education. The percentages who moved varied with the type of credential obtained - 85% who had a university degree moved, compared with 38% of those with a trades certificate and 45% with a college diploma.
High school completers were more likely than leavers to have moved for postsecondary studies (58% versus 27%).
Distance education
Distance education can reduce obstacles to postsecondary education, such as cost or the need to re-locate, especially for people in remote areas (Canadian Council on Learning, 2009). The 2012 APS asked respondents if they were able to access any of their postsecondary courses through the Internet or another form of distance education, and if they used this method of instruction. About 20% of Inuit aged 18 to 44 with postsecondary credentials used some form of distance education; 14%E had access to but did not use distance education. Two-thirds (66%) of those with postsecondary credentials reported that they did not have access to distance education, or that it was not applicable to their program or personal situation.
The percentages of Inuit high school completers and leavers who used distance education for their postsecondary studies did not differ significantly (23%E and 11%E).
Funding
The expenses associated with postsecondary education include not only tuition, but also, costs of re-location, transportation, housing, food, daycare, and other family responsibilities (Malatest et al, 2004). APS respondents were asked if the money available for their education was sufficient to meet all their needs or expenses. About one-quarter (27%) of Inuit who had postsecondary credentials reported that the money they had was not sufficient.
The percentages of Inuit high school completers and leavers who reported that the money they had to fund their postsecondary education was insufficient did not differ significantly (25% and 32%).
APS respondents were asked to indicate all7 their sources of funding for postsecondary education. A quarter (24%) of Inuit with postsecondary credentials had applied for and received a government student loan. Other sources included: funding from an Inuit Land Claim organization (51%), own savings or working while going to school (41%); grants, bursaries and scholarships (40%); money from family that did not need to be repaid (29%); Employment Insurance or other government funding (26%); bank loan or line of credit (12%E); and loan from family (5%E).
Inuit high school completers were more likely than leavers to fund their postsecondary studies with a government student loan (29% versus 13%E), with their own savings or working while going to school (47% versus 26%E), or through grants, bursaries or scholarships (46% versus 22%).
3. Started but did not finish
Reasons for non-completion
APS respondents who started but never finished a postsecondary program were asked why they did not complete their studies. Reasons cited by Inuit aged 18 to 44 included that they were pregnant or caring for their children (16%E); they had other family responsibilities(18%E); they lost interest or lacked motivation(12%E); their courses were too hard (10%E); they got a job or wanted to work (8%E); or that it was too difficult to be away from home (6%E).
One-third lacked funds
Just over one-third (35%) of Inuit aged 18 to 44 who started but never finished postsecondary studies said that the money available for their education was not sufficient to meet their needs or expenses. The percentages of high school completers and leavers who had insufficient money to fund postsecondary studies did not differ significantly (30% and 39%).
Section 4: Current employment experiences
Employment rates and employment income of Inuit have historically been lower than those of the non-Aboriginal population (Bernier, 1997; Wilson and MacDonald, 2010; Pendakur and Pendakur, 2011). Numerous factors have been related to the less favourable labour market outcomes of Inuit. These include lower educational attainment, insufficient training, lower proficiency in one of the two official languages, lone parenthood, greater geographic mobility, discrimination, and weak infrastructure in communities to support employment (Ciceri and Scott, 2006; Conference Board of Canada, 2002).
In recent years, the impact of the 2008 recession was greater and persisted longer for Aboriginal workers than for the non-Aboriginal population (Usalcas, 2011). Data from the 2011 National Household Survey (NHS) show a lower employment rate for Aboriginal people.
In 2011, 54% of Inuit were younger than 25, compared with 30% of the non-Aboriginal population (Statistics Canada, 2013b). It is important to understand the employment situation that these young Inuit could encounter as they enter the labour market over the next couple of decades.
This section examines the employment experiences of Inuit high school completers and leavers. Particular attention is paid to the role of education on various measures of employment. The first two subsections focus on people who were employed at the time of the 2012 Aboriginal Peoples Survey (APS) - their employment profile and their earnings. The third subsection examines those who were not working and barriers to employment. The final subsection looks briefly at people engaged in traditional activities such as hunting, trapping, and arts and crafts. Conventional measures of “labour force participation” may not reflect the complex work reality in northern communities where many Inuit live. The Canadian north is unique because it combines traditional Inuit and wage economies (Inuit Tapiriit Kanatami and Aboriginal Affairs and Northern Development Canada, 2007). Many Inuit contribute to their communities through traditional activities, which should be considered when examining the employment experiences of Inuit.
1. Overall labour force profile
Completers more likely to be employed
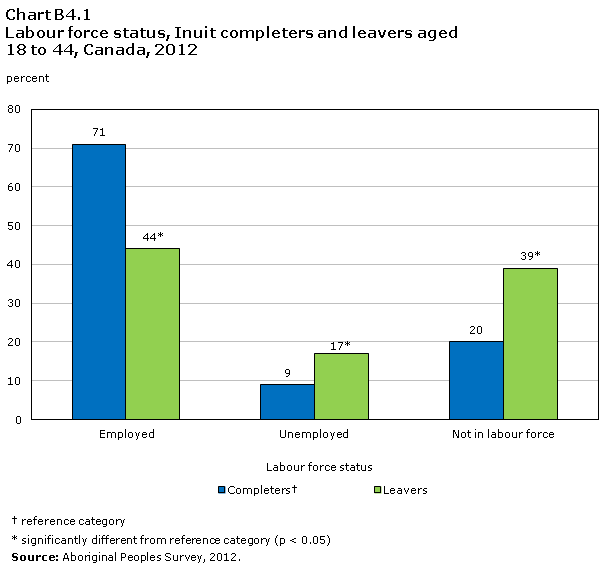
At the time of their 2012 APS interview, 71% of Inuit high school completers had a job; 9% were unemployed and looking for work; and 20% were not in the labour force (neither working nor looking for work) (Chart B4.1).
The labour force profile of leavers was different - 44% were employed; 17% were unemployed; and 39% were not in the labour force (Chart B4.1).
2. Inuit workers
According to APS data, the higher the level of education of completers and leavers, the more likely they were to be employed. Even though they had not completed the requirements for a high school diploma, 28% of employed Inuit leavers had some education beyond high school - 6% had a college diploma; 10% had a trades certificate; and 11% had at least some postsecondary education.
Men and women equally likely to be employed
Men usually have higher rates of employment than women, who have historically had family responsibilities that can prevent them from participating in the labour force to the same extent as men (Ferrao, 2010). However, for Inuit, the differences were not significant. Among both Inuit completers and leavers, women were just as likely as men to have a job.
Young completers less likely to be employed
Generally, youth have lower employment rates than adults, mainly because many young people are often still attending school, and therefore, may be unable or unwilling to hold a job (Shaienks and Gluszynski, 2009; Bernard, 2013).
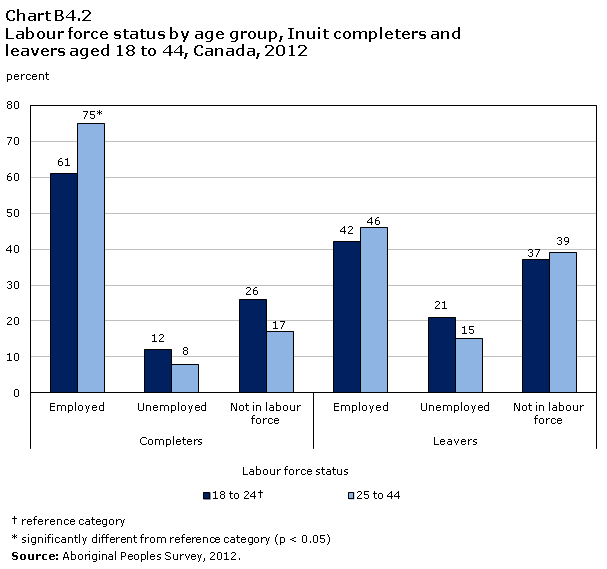
Inuit completers aged 18 to 24 were significantly less likely than those aged 25 to 44 to be employed: 61% versus 75%. The difference in the percentages of younger and older leavers who were employed was not statistically significant (Chart B4.2).
Majority worked full-time
At the time of their 2012 APS interview, the majority of employed Inuit completers (84%) and leavers (81%) were working full time. However, among leavers, employed men were more likely than employed women to work at least 30 hours a week (88% versus 73%).
As expected, young Inuit workers were significantly less likely than older workers to be employed full time: 69% versus 88%. This pattern prevailed among completers and leavers.
Reasons for part-time work
The 2012 APS asked part-time workers the main reason why they were working less than 30 hours a week. Half (49%) of Inuit completers and leavers worked part time because they could not find full-time work.8
Median employment income range
The median employment income range of Inuit completers was $30,000 to $40,000.9,10 For completers, higher education translated into higher median income. Completers with no education beyond high school graduation reported a median employment income range of $20,000 to $30,000; those with a trades certificate or a college diploma reported $40,000 to $50,000. The exception was those with some postsecondary whose median employment income was in the $10,000-to-$20,000 range.
The median employment income range of leavers was $10,000 to $20,000. Again, higher education was associated with higher median income. Leavers with some postsecondary education reported median employment income in the $20,000-to-$30,000 range, and those with a trades certificate or college diploma, in the $30,000-to-$40,000 range.
Employment income differed for male and female Inuit workers. Among completers, women reported a median employment income range of $30,000 to $40,000, and men, $40,000 to $50,000. Among leavers, women’s median employment income was in the $10,000-to-$20,000 range, and that of men, in the $20,000-to-$30,000 range.
3. Unemployed and not in the labour force
More than half (56%) of Inuit leavers and 29% of completers were not working at the time of their 2012 APS interview.11 Specifically, 17% of leavers were unemployed, and 39% were not in the labour force. The corresponding figures for completers were 9% and 20% (Chart B4.1).
Reasons for not finding work among unemployed
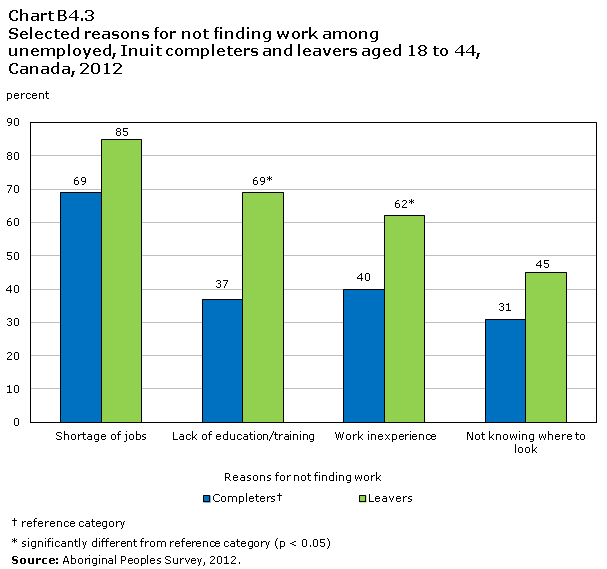
The most common difficulties cited by Inuit searching for work were a shortage of jobs (80%), not having the necessary training and education (60%), lacking the necessary work experience (55%), and not knowing where to look (41%).12
Completers and leavers were equally likely to cite job shortages and not knowing where to look as reasons for not finding work. As expected, leavers were more likely than completers to say they did not have the appropriate education or training (69% versus 37%) and that they lacked work experience (62% versus 40%) (Chart B4.3).
Non-participation in labour force
Many people who are not in the labour force are retirees, homemakers, students or permanently unable to work. Others are waiting for replies from potential employers, waiting to be recalled to a former job, or discouraged as they believe no work is available. On the other hand, some who are not in the labour force do indeed want a job. This was the case for more than one third (37%) of Inuit who were not in the labour force.
The 2012 APS asked those who were not in the labour force but wanted a job why they did not look for work. The main reasons were that they believed no work was available in the area or suited to their skills (23%) and caring for their own children (17%E). One-quarter (26%E) of women said they did not look for work because they were caring for children, and 31%E of men said no work was available.
4. Traditional activities
Many Inuit are involved in the arts and traditions of their culture. Traditional activities include making clothing or footwear; arts and crafts; hunting, fishing, and trapping; and gathering wild plants. For Inuit, these activities may be a supplement to, or a substitute for, participating in the monetarized labour market (Inuit Tapiriit Kanatami, 2007).
According to the 2012 APS, 84% of Inuit adults had taken part in at least one traditional activity in the past year. The percentages did not differ for high school completers and leavers or for men and women. Participation in traditional activities was not associated with educational attainment.
One-fifth of Inuit adults participated in these activities for money. Among leavers, men were more likely than women to engage in traditional activities for money or as supplementary income (28% versus 18%), but there were no significant differences among completers.
Section 5: Further education or training
The previous sections examined respondents’ past education experiences and their employment status at the time of the survey. The 2012 Aboriginal Peoples Survey (APS) also asked Inuit aged 18 to 44 questions about their future education plans and obstacles to additional schooling.
Barriers such as cost, time constraints and family responsibilities can prevent people from taking the education or training they would like. Aboriginal students are particularly likely to face challenges in furthering their education (Canadian Council on Learning, 2009). Some, for example, may lack financial resources, or be unaware of help available through student aid programs. Other barriers may include skepticism about the employment benefits of additional education (which can lead to motivational issues), and experienced or perceived racism (Canadian Council on Learning, 2009).
Barriers to further education or training
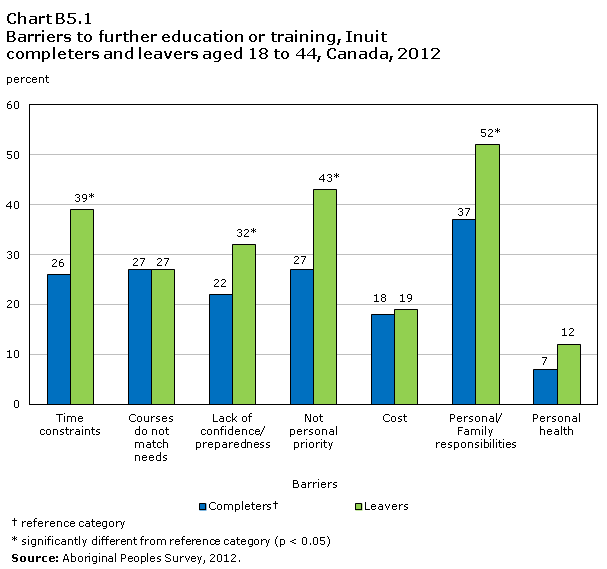
According to the APS, the factors that prevent Inuit aged 18 to 44 from taking further education or training differed for high school leavers and completers. As well, differences emerged by gender for certain barriers.
Many Inuit reported that personal or family responsibilities keep them from further education (Chart B5.1). Two-thirds (66%) of female leavers identified this obstacle; a rate that was higher than that for female completers (44%), male leavers (37%) and male completers (27%). Related to this, female leavers (43%) were more likely than female completers (29%) to mention time constraints (too busy, no time to study) as an obstacle to further education; the percentages reporting this barrier among male leavers and completers did not differ significantly (35% and 22%E).
While leavers were more likely than completers to report that additional schooling was not a personal priority (43% versus 27%) and that they lacked confidence or felt unprepared (32% versus 22%), completers and leavers were equally likely (27% for both) to report that they were not pursuing education or training because the courses available did not match their needs or interests. The percentages of completers and leavers (just under 20%) who reported cost as an impediment to further education also did not differ significantly, nor did the percentages for personal health (7% of completers and 12% of leavers cited this barrier).
Half plan further education
The 2012 APS asked if respondents had plans to “take any other education that could be counted towards a certificate, diploma or degree from an educational institution.”13 Just over half (55%) of Inuit aged 18 to 44 reported such plans; an additional 5% indicated that they were uncertain. The percentages of high school leavers and completers reporting plans for further schooling did not differ significantly (51% and 59%).
Women were more likely than men to plan further education (62% versus 46%), and as expected, 18- to 24-year-olds were more likely than those aged 25 to 44 to report such plans (61% versus 52%).
Unemployed most likely to plan further education
Inuit who were unemployed were the most likely to report plans to further their schooling - 71%, compared with 52% of those who were employed, and 54% of those not in the labour force. Among women and 25- to 44-year-olds, the percentages planning further education did not differ significantly between the unemployed and those not in the labour force.
Notes
- A detailed analysis of the Aboriginal population based on the 2011 NHS is available in Aboriginal Peoples in Canada: First Nations People, Métis and Inuit.
- Given the structure of the educational system in Quebec, the typical student will graduate from high school one year younger than those in other provinces.
- The category “school problems” includes having problems with school work, with teachers, or being expelled.
- In this study, “Aboriginal” refers to students who self-identified as being Aboriginal in British Columbia’s Ministry of Education data, and thus, may include First Nations (Status and non-Status), Métis, and Inuit students.
- The 2012 APS allows for analysis of those who started but never finished postsecondary education. Similar data are not available from the National Household Survey, as it asked only about the highest certificate, diploma or degree completed. Consequently, results from the two surveys are not directly comparable.
- While most individuals aged 18 to 24 would not be expected to have a university degree, the analyses include this age group because they could have obtained a trades certificate or a college diploma.
- Percentages for sources of funding do not add to 100%, because respondents could indicate more than one source.
- The small sample size precludes further analysis by gender or age.
- Because personal employment income was reported in ranges, a median income range is calculated. The “median range” is the category for which the cumulative percentage of reporting respondents came closest to 50%.
- Data pertain only to those who were employed in the week before their APS interview and who reported their personal employment income.
- It is important to distinguish between the two categories of “not working.” Respondents who had actively looked for a job in the previous four weeks are defined as “unemployed”; those who did not work and did not look for work are classified as “not in the labour force.”
- Percentages do not add to 100% because respondents could identify more than one reason.
- For respondents attending a postsecondary institution at the time of their APS interview, this referred to education beyond their current studies.
- Date modified: