
Labour Force Information
Chart 8

Archived Content
Information identified as archived is provided for reference, research or recordkeeping purposes. It is not subject to the Government of Canada Web Standards and has not been altered or updated since it was archived. Please "contact us" to request a format other than those available.
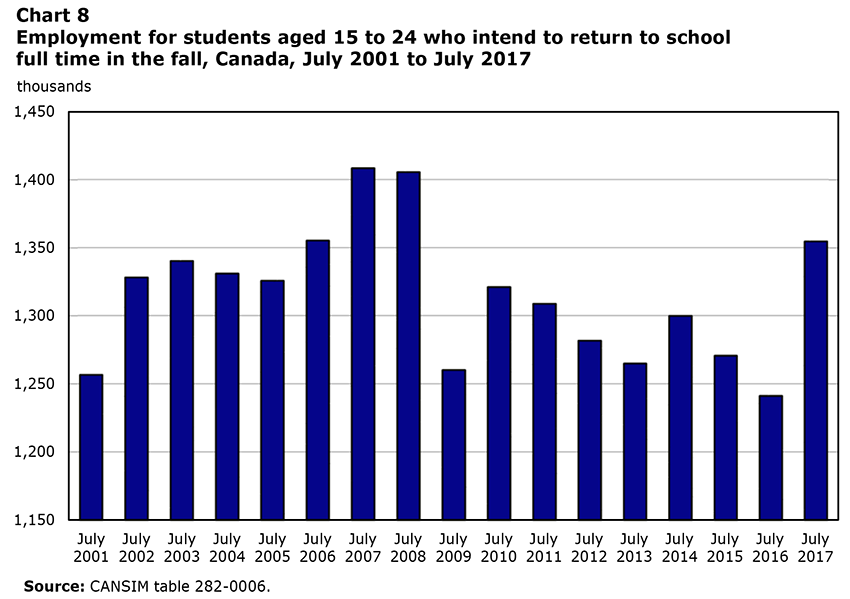
Description for Chart 8
| Employment | |
|---|---|
| thousands | |
| July 2001 | 1,257.1 |
| July 2002 | 1,328.3 |
| July 2003 | 1,340.4 |
| July 2004 | 1,331.2 |
| July 2005 | 1,325.9 |
| July 2006 | 1,355.3 |
| July 2007 | 1,408.2 |
| July 2008 | 1,405.4 |
| July 2009 | 1,260.6 |
| July 2010 | 1,321.4 |
| July 2011 | 1,309.2 |
| July 2012 | 1,282.1 |
| July 2013 | 1,265.4 |
| July 2014 | 1,300.2 |
| July 2015 | 1,271.2 |
| July 2016 | 1,241.7 |
| July 2017 | 1,354.7 |
| Source: CANSIM table 282-0006. | |
- Date modified: