
 StatCan COVID-19: Data to Insights for a Better CanadaTransitions into and out of employment by immigrants during the COVID-19 lockdown and recovery

Archived Content
Information identified as archived is provided for reference, research or recordkeeping purposes. It is not subject to the Government of Canada Web Standards and has not been altered or updated since it was archived. Please "contact us" to request a format other than those available.
by Feng Hou, Garnett Picot and Jue Zhang
Start of text box

This article provides disaggregated data to better understand the impact of COVID-19 on specific groups. Visit the Gender, Diversity and Inclusion Statistics Hub for more analysis, including disaggregated data on labour, public safety, health and more.
End of text box
During the widespread lockdown of economic activities in March and April 2020, the Canadian labour market lost 3 million jobs. From May to July, as many businesses gradually resumed their operations, 1.7 million jobs were recovered. While studies in the United States and Europe suggest that immigrants are often more severely affected by economic downturns than the native born (Borjas and Cassidy 2020; Botric 2018), little is known about whether immigrants and the Canadian born fared differently in the employment disruption induced by the COVID-19 pandemic and, if so, how such differences are related to their socio-demographic and job characteristics. This paper fills this gap by comparing immigrants and the Canadian-born population in their transitions out of employment in the months of heavy contraction and into employment during the months of partial recovery. The analysis is based on individual-level monthly panel data from the Labour Force Survey and focuses on the population aged 20 to 64. Immigrants are grouped into recent immigrants who landed in Canada within 10 years or less, and long-term immigrants who landed in Canada more than 10 years earlier.
There are reasons to expect immigrants to be more negatively affected by the economic fallout of the pandemic. Recent immigrants tend to have shorter job tenure than the Canadian born, and workers with short tenure are more susceptible to layoffs during an economic downturn (Chan, Morissette and Qiu 2020). For instance, in February, before the impact of the pandemic, 31% of employed recent immigrants had been in their jobs for less than one year, compared with 15% of Canadian-born workers. Furthermore, recent immigrants are often much more likely to work in lower paying jobs than Canadian-born workers, and the employment losses in March and April were heavily concentrated among lower paying jobs (Lemieux et al. 2020). In February, 22% of recent immigrants were in low-wage jobs (with hourly wages less than two-thirds of the 2019 annual median wage of $24.04/hour), compared with 12% among Canadian-born workers.Note More broadly, recent immigrants often have difficulty transferring their educational and job qualifications to the labour market and finding steady, good paying jobs.
Recent immigrants were more likely than Canadian-born workers to move out of employment in March and April mainly because of their shorter job tenure and over-representation in lower-wage jobs
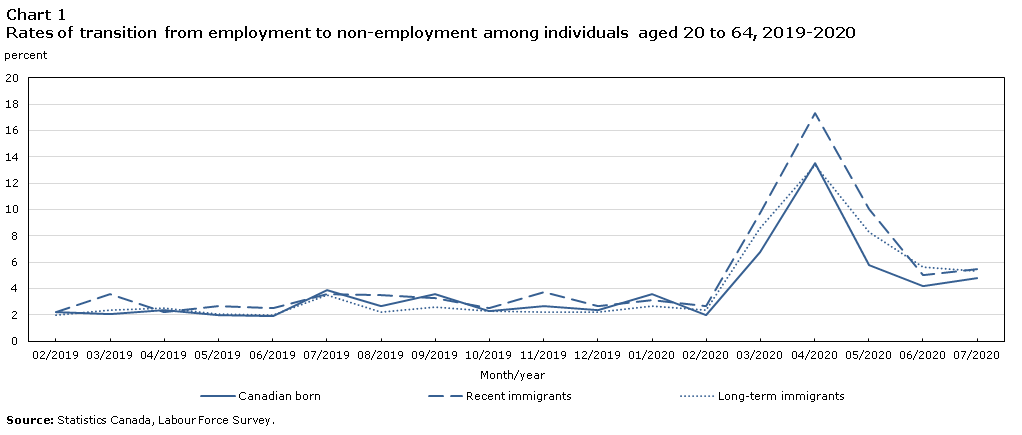
The rate of transition from employment to non-employment is the share of individuals employed in the previous month (e.g., February) who are not employed in the current month (e.g., March).
Prior to the lockdown, the rate of transition to non-employment was low and similar for the three population groups, fluctuating between 2% and 4% over February 2019 to February 2020 (Chart 1). As the pandemic hit, the rate jumped for all three groups, but much more so among recent immigrants, peaking in April at 17.3% for recent immigrants and 13.5% for the Canadian born and long-term immigrants. From April to July, as the economy began to recover, the rate declined for all three groups.
Female recent immigrants experienced the largest increase in the rate of transition to non-employment during the contraction. Almost 20% of those employed in March were not employed in April, 7 percentage points higher than among Canadian-born women (Table 1). This gap remained at 2 points in June but mostly disappeared in July as the rate increased slightly among Canadian-born women.
Data table for Chart 1
| Month/year | Canadian born | Recent immigrants | Long-term immigrants |
|---|---|---|---|
| percent | |||
| 02/2019 | 2.2 | 2.2 | 2.0 |
| 03/2019 | 2.1 | 3.6 | 2.4 |
| 04/2019 | 2.4 | 2.2 | 2.5 |
| 05/2019 | 2.0 | 2.7 | 2.1 |
| 06/2019 | 1.9 | 2.5 | 2.0 |
| 07/2019 | 3.9 | 3.6 | 3.5 |
| 08/2019 | 2.7 | 3.5 | 2.2 |
| 09/2019 | 3.6 | 3.3 | 2.6 |
| 10/2019 | 2.3 | 2.5 | 2.3 |
| 11/2019 | 2.7 | 3.7 | 2.2 |
| 12/2019 | 2.4 | 2.7 | 2.2 |
| 01/2020 | 3.6 | 3.1 | 2.7 |
| 02/2020 | 2.0 | 2.7 | 2.4 |
| 03/2020 | 6.8 | 9.7 | 8.6 |
| 04/2020 | 13.5 | 17.3 | 13.4 |
| 05/2020 | 5.8 | 10.0 | 8.3 |
| 06/2020 | 4.2 | 5.0 | 5.6 |
| 07/2020 | 4.8 | 5.5 | 5.3 |
| Source: Statistics Canada, Labour Force Survey. | |||
Statistical analysis is used to help understand why recent immigrants had a higher transition rate out of employment than the Canadian born.Note The higher share of recent immigrant women holding lower-wage jobs accounted for 30% of their 7 percentage-point gap with Canadian-born women in the rate of transition out of employment in April, while their higher shares with shorter tenured jobs and in accommodation and food services each accounted for another 15% of the gap. The higher share of recent immigrant men with shorter tenured jobs accounted for 30% of their 3 percentage-point gap with Canadian-born men in March, while their higher shareholding lower-wage jobs and living in the three largest metropolitan areas each accounted for another 15% of the gap.
| January to February | February to March | March to April | April to May | May to June | June to July | |
|---|---|---|---|---|---|---|
| percent | ||||||
| Transition from employment to non-employment | ||||||
| Men | ||||||
| Canadian born | 2.2 | 5.8 | 14.0 | 5.4 | 3.5 | 3.7 |
| Recent immigrants | 2.1 | 8.8 | 15.4 | 8.4 | 3.2 | 4.6 |
| Long-term immigrants | 2.1 | 6.5 | 12.1 | 6.6 | 4.5 | 3.7 |
| Women | ||||||
| Canadian born | 1.9 | 7.9 | 12.9 | 6.3 | 5.0 | 6.1 |
| Recent immigrants | 3.4 | 10.8 | 19.9 | 12.2 | 7.4 | 6.5 |
| Long-term immigrants | 2.7 | 10.8 | 14.8 | 10.2 | 6.9 | 7.1 |
| Transition from non-employment to employment | ||||||
| Men | ||||||
| Canadian born | 9.6 | 9.8 | 10.2 | 23.8 | 24.2 | 15.4 |
| Recent immigrants | 12.7 | 15.7 | 13.7 | 20.6 | 27.3 | 18.0 |
| Long-term immigrants | 9.9 | 8.4 | 11.9 | 20.4 | 26.5 | 16.7 |
| Women | ||||||
| Canadian born | 6.6 | 6.5 | 10.3 | 17.1 | 20.8 | 13.7 |
| Recent immigrants | 6.1 | 6.3 | 9.3 | 12.2 | 15.6 | 11.6 |
| Long-term immigrants | 6.1 | 5.9 | 8.7 | 14.6 | 16.6 | 13.6 |
| Source: Statistics Canada, Labour Force Survey. | ||||||
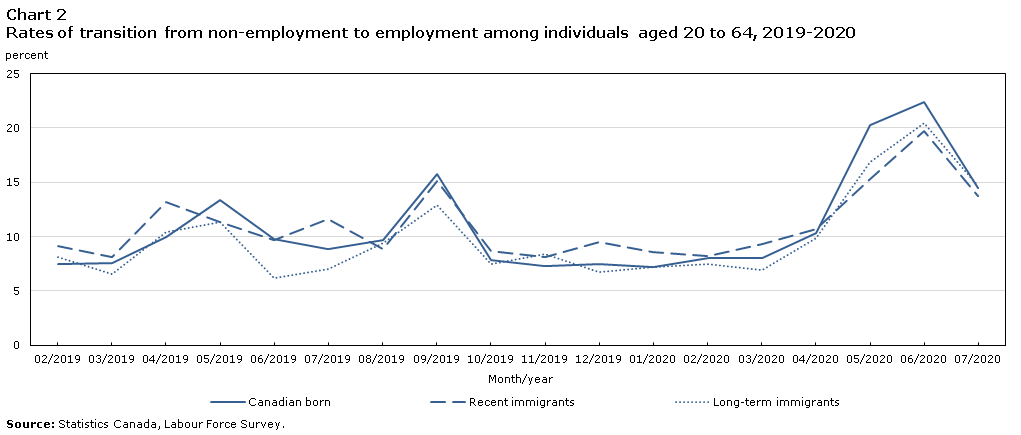
Female recent immigrants had lower rates of transition from non-employment to employment at the start of partial recovery
The rate of transition from non-employment to employment is the share of people not employed in the previous month who are employed in the current month. From February 2019 to April 2020, the three groups had similar rates of transition into employment, with recent immigrants having a slightly higher rate than the Canadian born in most months (Chart 2). However, as the transition to employment increased during the partial recovery, recent immigrants had transition rates that were 5 percentage points lower than those of Canadian-born individuals in May, 3 points lower in June, and 1 point lower in July. Recent immigrant women displayed the largest gap with their Canadian-born counterparts, at 5 percentage points in both May and June, and 2 points in July (Table 1).
Data table for Chart 2
| Month/year | Canadian born | Recent immigrants | Long-term immigrants |
|---|---|---|---|
| percent | |||
| 02/2019 | 7.5 | 9.1 | 8.1 |
| 03/2019 | 7.6 | 8.1 | 6.6 |
| 04/2019 | 10.0 | 13.2 | 10.4 |
| 05/2019 | 13.4 | 11.3 | 11.3 |
| 06/2019 | 9.8 | 9.7 | 6.2 |
| 07/2019 | 8.9 | 11.6 | 7.0 |
| 08/2019 | 9.7 | 8.9 | 9.4 |
| 09/2019 | 15.8 | 15.1 | 12.9 |
| 10/2019 | 7.8 | 8.7 | 7.5 |
| 11/2019 | 7.3 | 8.1 | 8.4 |
| 12/2019 | 7.5 | 9.5 | 6.7 |
| 01/2020 | 7.2 | 8.6 | 7.2 |
| 02/2020 | 8.0 | 8.2 | 7.5 |
| 03/2020 | 8.0 | 9.3 | 6.9 |
| 04/2020 | 10.3 | 10.7 | 9.9 |
| 05/2020 | 20.3 | 15.3 | 16.9 |
| 06/2020 | 22.4 | 19.7 | 20.5 |
| 07/2020 | 14.5 | 13.7 | 14.7 |
| Source: Statistics Canada, Labour Force Survey. | |||
These gaps for female recent immigrants became even larger after taking into account their differences with Canadian-born women in terms of age, education, and geographical location. These gaps were likely driven by differential employment growth between recent immigrant and Canadian-born women by industrial sector and wage level. From April to July, recent immigrant women lagged behind Canadian-born women in employment growth in the accommodation and food service sector (4% versus 72%), although they had similar rates of employment growth in other major industrial sectors. Over the same period, employment in low-wage jobs grew much slower (11%) among recent immigrant women than among Canadian-born women (36%), while their growth rates in higher-wage jobs were similar. It remains to be seen whether these differences will disappear as the economy further improves.
References
Borjas, G. J. and H. Cassidy. 2020. “The adverse effect of the COVID-19 labor market shock on immigrant employment.” IZA Discussion Paper No. 13277.
Botric, V. 2018. “Labour market transition differences between natives and immigrants in EU economies.” Journal of Economic and Social Studies 7 (2): 22-55.
Chan, P.C., R. Morissette and H. Qiu, 2020. “COVID-19 and job displacement: Thinking about the longer term.” Statistics Canada, Catalogue no. 45-28-0001 20200001 No. 00030. Ottawa. Statistics Canada.
Lemieux, T., K. Milligan, T. Schirle and M. Skuterud. 2020. “Initial impacts of the COVID-19 pandemic on the Canadian labour market.” Working Paper Series, No. 26, University of Waterloo, Canadian Labour Economics Forum (CLEF), Waterloo.
- Date modified: