
Publications
Human Activity and the Environment – Teacher’s Kit
- 16-507-X
- Main Page
-
Lesson #1:
What is an ecosystem? -
Lesson #2:
What are ecosystem goods and services? -
Lesson #3:
How can the value of ecosystem goods and services be measured? -
Detailed lesson plan #1:
Can the value of ecosystems and ecosystem goods and services be measured? -
Detailed lesson plan #2:
The value of ecosystem goods and services in changing ecosystems -
Case study #1:
Thousand Islands National Park case study -
Case study #2:
Exploring methodologies for measuring ecosystem goods and services - Image collection
- More information
- PDF version
Case study #2 Exploring methodologies for measuring ecosystem goods and services

Archived Content
Information identified as archived is provided for reference, research or recordkeeping purposes. It is not subject to the Government of Canada Web Standards and has not been altered or updated since it was archived. Please "contact us" to request a format other than those available.
Instructor’s overview
This case study explores the indicators, measures and methods used to determine the quantity and quality of ecosystems and value of ecosystem goods and services (EGS) in Canada. It has three components:
- First, learners examine the experimental indicators developed for the Statistics Canada publication, Human Activity and the Environment 2013: Measuring ecosystem goods and services in Canada (MEGS), and propose additional measures that could be used.
- Next, learners identify the limitations and issues associated with the data and methodologies used for the MEGS publication.
- Finally, learners develop a letter to Statistics Canada recommending improvements to address a specific limitation or issue relating to the analysis presented in the MEGS publication.
This case study directs learners to respond to a number of questions; these questions can be used solely for learner understanding and not be assessed, or they can be developed as discreet assignments.
Audience
- senior high school
- introductory post-secondary
Learning outcomes
- understand indictors used to determine the quality and quantity of ecosystems and EGS
- understand the various limitations and issues of research methods associated with ecosystem accounting
Curriculum links
- grades 10 to 12 geography (ecosystems, geographic change), social studies (economics), biology (ecosystems and change), science, economics (accounting, ecosystem accounting, valuation methods)
- post-secondary geography (ecosystems), environmental science (ecosystem accounting, ecosystem change)
Learning materials
- Statistics Canada publication, Human Activity and the Environment 2013: Measuring ecosystem goods and services in Canada (MEGS)
- Case study activity sheet #4: Measuring ecosystems and ecosystem goods and services (DOC) (HTML)
- Case study activity sheet #5: Identifying limitations and issues (DOC) (HTML)
- Case study activity sheet #6: Developing improvements (DOC) (HTML)
- Case study assessment support #2: Assessing improvements and recommendations (DOC) (HTML)
Learner instructions
Imagine you are a consultant hired by Statistics Canada to recommend improvements to the data and analysis used to measure ecosystems and EGS in Canada.
In preparing your recommendations you will undertake three tasks:
- Examine the experimental indicators developed for the Statistics Canada publication, Human Activity and the Environment 2013: Measuring ecosystem goods and services in Canada (MEGS), and think of additional measures that could be used.
- Identify the limitations and issues associated with the data and methodologies used for the MEGS publication and ecosystem accounting.
- Prepare a letter to Statistics Canada recommending improvements to address a specific limitation or issue that you have identified about the data and analysis used by Statistics Canada.
Learning materials
- Statistics Canada publication, Human Activity and the Environment 2013: Measuring ecosystem goods and services in Canada (MEGS)
- Case study activity sheet #4: Measuring ecosystems and ecosystem goods and services (DOC) (HTML)
- Case study activity sheet #5: Identifying limitations and issues (DOC) (HTML)
- Case study activity sheet #6: Developing improvements (DOC) (HTML)
- Case study assessment support #2: Assessing improvements and recommendations (DOC) (HTML)
Explore indicators and measures
Your first task is to explore and develop indicators used to determine the quantity and quality of ecosystems and EGS.
First, examine the indicators and related data and information presented in the MEGS publication (Section 3, pages 24 to 60). The document introduces several indicators designed to provide information on the quantity and quality of ecosystems and EGS (e.g., land cover change, landscape modification, ecosystem services potential, biomass extraction, marine and coastal ecosystems, freshwater wetland ecosystems).
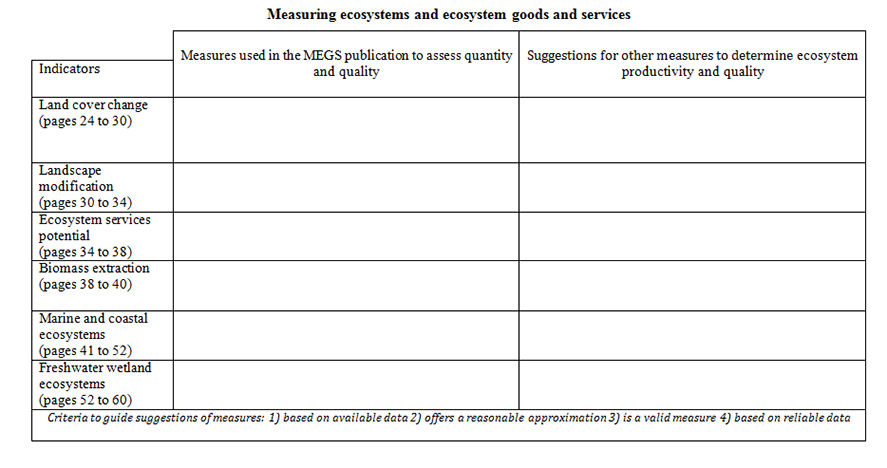
Using Case study activity sheet #4: Measuring ecosystems and ecosystem goods and services, identify the measures used to estimate the quantity and quality of ecosystems and EGS for each of these indicators. Information on these indicators can be found in the sections noted below:
- land cover change (pages 24 to 30)
- landscape modification (pages 30 to 34)
- ecosystem services potential (pages 34 to 38)
- biomass extraction (pages 38 to 40)
- marine and coastal ecosystems (pages 41 to 52)
- freshwater wetland ecosystems (pages 52 to 60)
Identify the measures used for each indicator and record these in the appropriate section of the chart. For example, fish harvest (tonnes and $) is used as a measure of the EGS provided by marine and coastal ecosystems.
More information about these indicators and related valuation can be found in Appendices A to F of the MEGS publication.
Next, reflect on the identified measures in light of the following four criteria for effective measures and indicators:
- Is based on available data: there must be readily available data to quantify the measure or the data must be easily and inexpensively obtainable.
- Offers a reasonable approximation: although there will always be a margin of error, data must provide a reasonably accurate estimation of the quality or value of the measured variable.
- Is a valid measure: there must be a demonstrable relationship between the indicator and the measure. For example, salmon catch can be related to the health of marine and coastal ecosystems on the west coast of Canada.
- Is based on reliable data: the data to support the measure must be reproducible on other occasions and not be subject to wild fluctuations.
Finally, use these criteria to generate other measures that could be used to determine the quantity and quality of ecosystems and EGS. For example, changes in the amount of man-made light emitted at night (called night luminosity) is a measure that could be used to quantify conversion to settled landscapes. Record these suggestions in the appropriate section of the chart.
Analyze limitations and issues
Your second task is to analyze limitations and issues relating to the data and analysis presented in the MEGS publication.
First, review some of the limitations and issues identified in the MEGS publication (pages 78 to 80):
- Spatial datasets
- Development of indicators
- Characterization of EGS for marine and coastal ecosystems
- Case studies
- Valuation of EGS flows
- Natural capital asset boundaries
Other limitations and issues are identified in other sections of the MEGS publication (pages 24 to 60, in table and map notes, footnotes, as well as in the appendices).
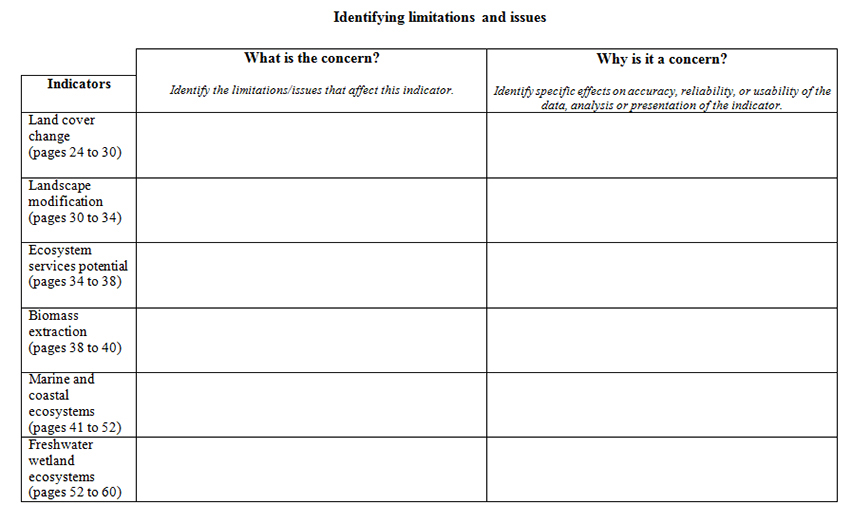
Using Case study activity sheet #5: Identifying limitations and issues, analyze each of the six indicators (pages 24 to 60). Identify at least one limitation or issue identified in the report that may have had a significant effect on the quality of the data, analysis, or presentation of the indicator. For example, limitations and issues with spatial resolution (an aspect of spatial datasets), may have impacted the accuracy of land cover measurement and the usability of this data for local level analyses.
Record the applicable limitations and issues and their corresponding specific impacts in the designated places in the chart.
Finally, use this information to respond to the following questions:
- Which of the six indicators was most affected by a limitation or issue? What evidence supports this?
- Referring to the above criteria, which of the indicators presents the most effective use of data? What evidence supports this?
- Why is it important to consider the effects of these limitations and issues?
- Statistics Canada has indicated that the list of limitations or issues is incomplete; what others might be identified? What evidence supports this?
Develop recommendations
Your final task is to prepare a letter to Statistics Canada with recommendations on accessible, reasonable, valid and reliable improvements that address the limitations or issues relating to data or analysis presented in the MEGS publication.
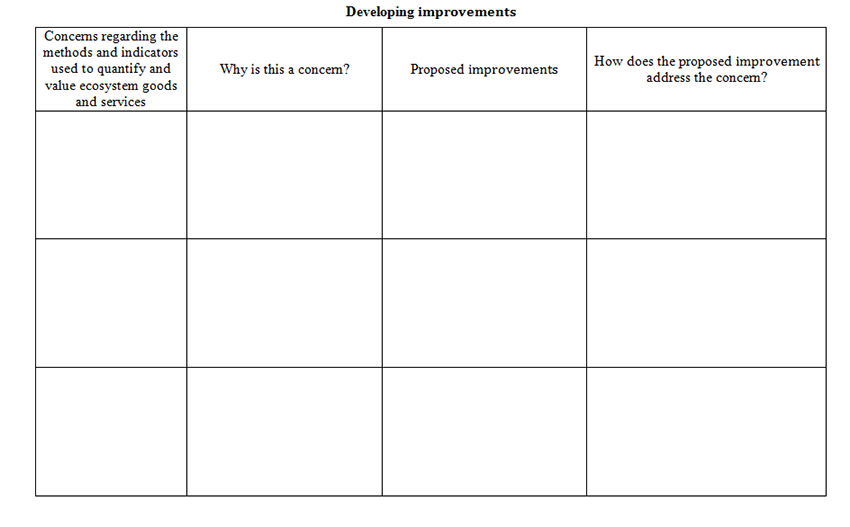
Use the following steps and Case study activity sheet #6: Developing improvements to prepare your letter:
- Identify up to three concerns regarding the indicators and methods used to quantify and value EGS in Canada.
- Explain why each is a concern. Be sure to include supporting detail and evidence from MEGS or other sources.
- Recommend a solution for each of the concerns.
- Explain why each recommendation is an improvement.
Be sure to consider the following criteria when developing improvements:
- Accessible: the improvement must be based upon readily available methods, technology or data.
- Reasonable: the improvement must provide a reasonably accurate estimation of the quality or value of the measured variable.
- Valid: there must be a demonstrable relationship between the improvement and the concern.
- Reliable: the improvement must be reproducible on multiple occasions and not be subject to wild fluctuations.
Finally, compose a letter to Statistics Canada describing the recommended improvements. The letter should include:
- the limitations or issues related to data or analysis being addressed
- details of the effects or challenges related to the limitation/issue
- specific recommendations on improvements with explanation on how they will address the concern.
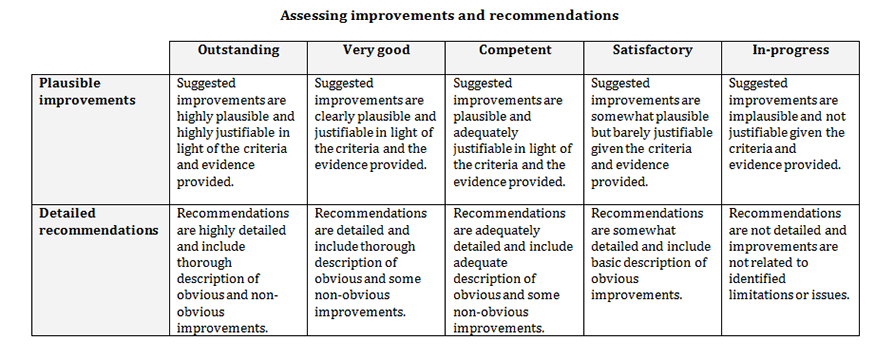
Consider using Case study assessment support #2: Assessing improvements and recommendations for self-assessment of the recommendations and letter.
Case study activity sheet #4
Description for case study activity sheet #4 (DOC)
Case study activity sheet #5
Description for case study activity sheet #5 (DOC)
Case study activity sheet #6
Description for case study activity sheet #6 (DOC)
Case study assessment support #2
- Date modified: