
The income of Canadians

Archived Content
Information identified as archived is provided for reference, research or recordkeeping purposes. It is not subject to the Government of Canada Web Standards and has not been altered or updated since it was archived. Please "contact us" to request a format other than those available.
Release date: March 13, 2018
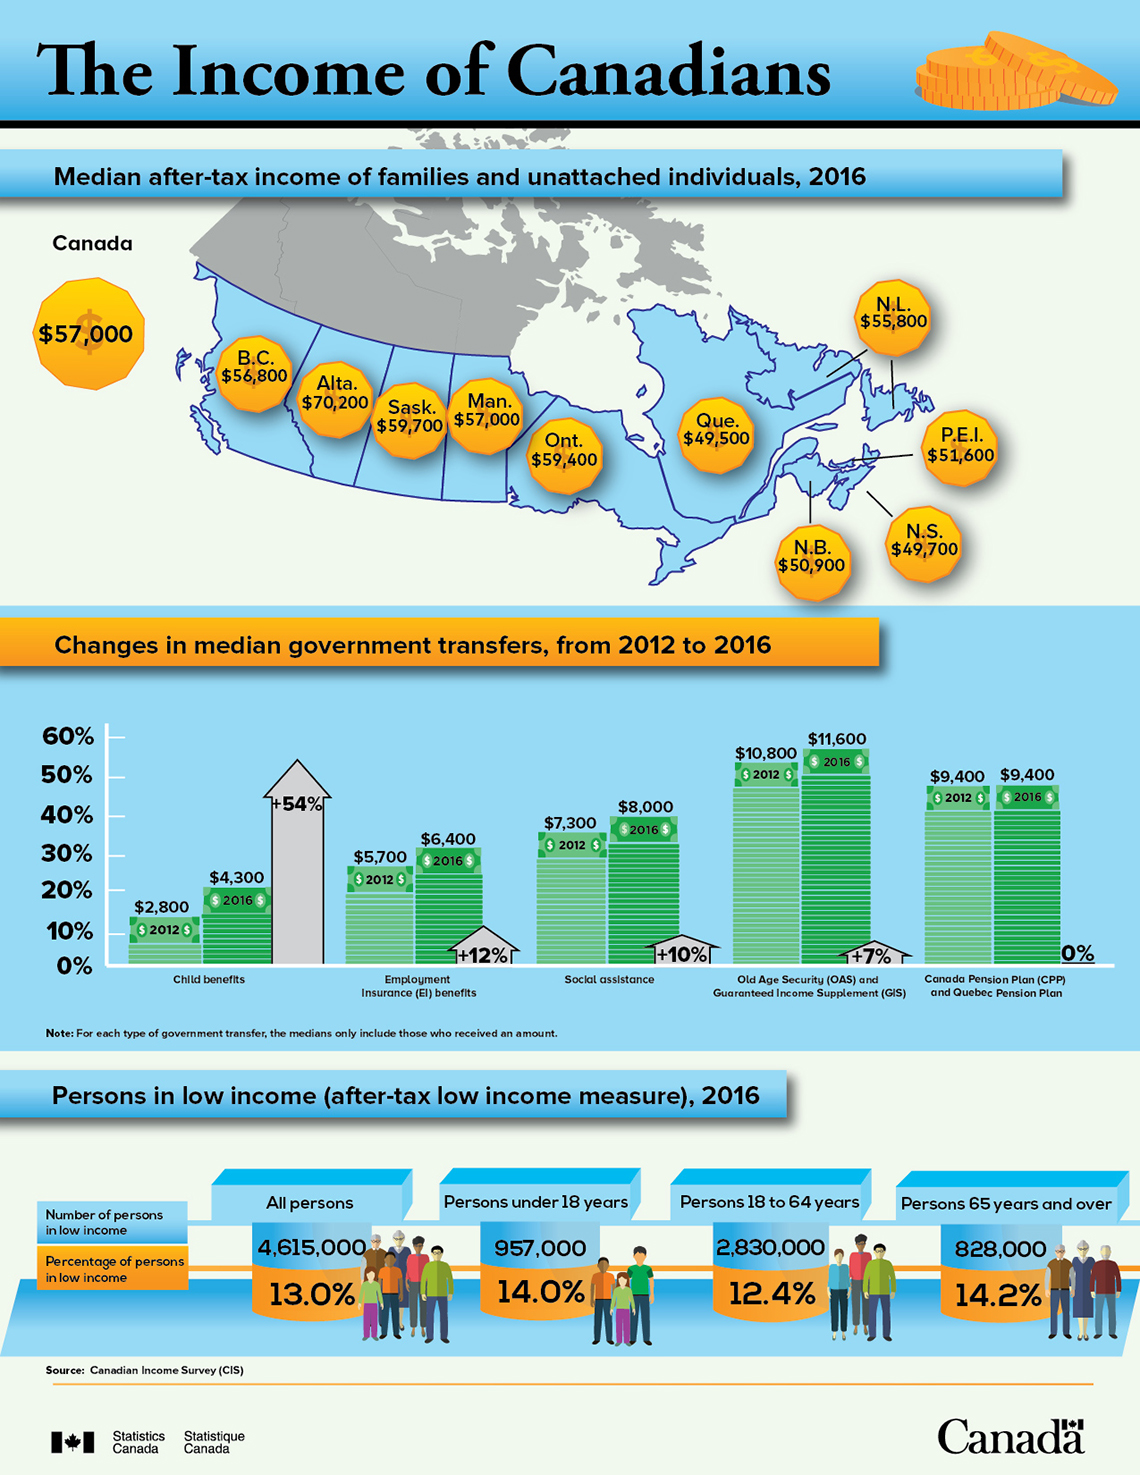
Description: The income of Canadians
| Province | Income |
|---|---|
| Canada | $57,000 |
| B.C. | $56,800 |
| Alta. | $70,200 |
| Sask. | $59,700 |
| Man. | $57,000 |
| Ont. | $59,400 |
| Que. | $49,500 |
| N.B. | $50,900 |
| N.S. | $49,700 |
| P.E.I. | $51,600 |
| N.L. | $55,800 |
| Child Benefits | Employment Insurance (EI) benefits | Social Assistance | Old Age Security (OAS) and Guaranteed Income Supplement (GIS) | Canada Pension Plan (CPP) and Quebec Pension Plan | |
|---|---|---|---|---|---|
| 2012 | $2,800 | $5,700 | $7,300 | $10,800 | $9,400 |
| 2016 | $4,300 | $6,400 | $8,000 | $11,600 | $9,400 |
| Percentage increase | 54% | 12% | 10% | 7% | 0% |
Note: For each type of government transfer, the medians only include those who received an amount.
| All persons | Persons under 18 years | Persons 18 to 64 years | Persons 65 years and over | |
|---|---|---|---|---|
| Number of persons in low income | 4,615,000 | 957,000 | 2,830,000 | 828,000 |
| Percentage of persons in low income | 13.0% | 14.0% | 12.4% | 14.2% |
Source: Canadian Income Survey (CIS)
- Date modified: