
Recent Developments in the Canadian Economy: Fall 2014

Archived Content
Information identified as archived is provided for reference, research or recordkeeping purposes. It is not subject to the Government of Canada Web Standards and has not been altered or updated since it was archived. Please "contact us" to request a format other than those available.
by Cyndi Bloskie, Sean Clarke and Guy Gellatly, Analytical Studies Branch
![]()
Start of text box
This article in the Economic Insights series provides users with an integrated summary of recent changes in output, employment, household demand, international trade and prices. Organized as a statistical summary of major indicators, the report is designed to inform about recent developments in the Canadian economy, highlighting major changes in the economic data during the first half of 2014. Unless otherwise noted, the tabulations presented in this report are based on seasonally adjusted data available in CANSIM on September 16, 2014.
End of text box
Overview
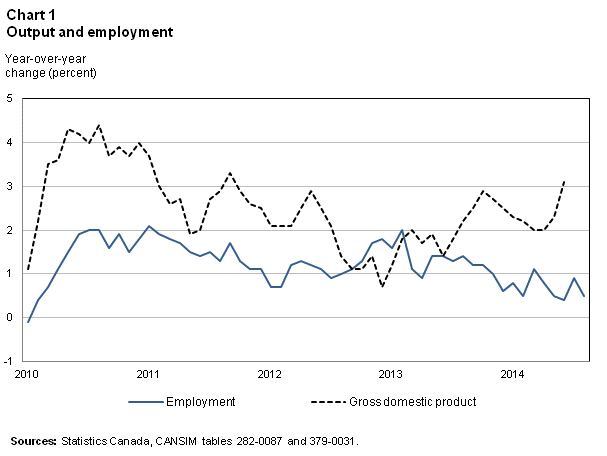
The pace and composition of economic growth varied over the first two quarters of 2014, as modest gains during winter months gave way to stronger, more broad-based growth during the spring. Household final expenditures accelerated in the second quarter, after moderating at the start of the year. Export volumes, which weighed on growth during the first quarter, contributed strongly to second-quarter gains. Increases in the volume of production were broad-based in late spring. The output of service industries increased steadily through the second quarter, while goods industries advanced in late spring. Auto sales were a major contributor to economic activity in May, bolstering manufacturing sales, wholesale and retail sales, exports and imports. Inflation increased during the spring months on higher prices for food, shelter and transportation. Employment growth remained subdued through the second quarter, as full-time and core-age employment declined in the six months to June. Evaluated on a year-over-year basis, output growth has outpaced employment growth since early 2013.
GDP accelerated in the second quarter on stronger exports and household spending
Real gross domestic product (GDP), measured on an expenditure basis, increased by 1.0% in the first half of 2014, following a 1.3% gain in the last half of 2013. In sum, exports and household spending on durables and non-durables led gains during the first half, while both residential and non-residential business investment declined.Note 1
However, the pace and composition of GDP growth varied markedly during the first half of 2014, as modest gains during winter months gave way to stronger growth in late spring. Real output accelerated by 0.8% in the second quarterNote 2, following growth of 0.2% in the first quarter, on stronger export volumes and a pick-up in household spending. Increased export volumes in the quarter (+4.2%) were led by autos, forestry and building and packaging materials, and farm and fishing products.

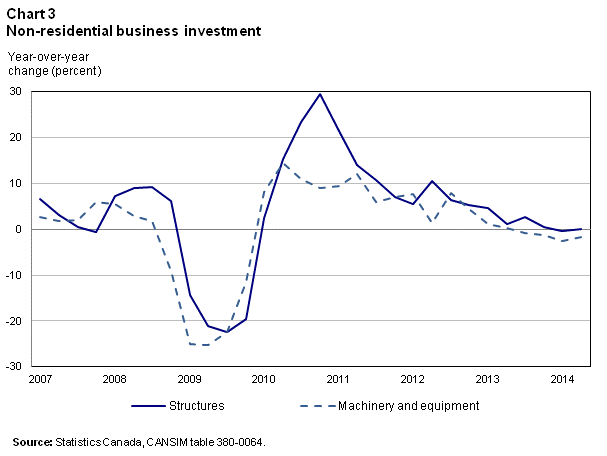
Household spending increased by 0.9% in the second quarter, buoyed by higher outlays on durable and semi-durable goods. As well, residential investment increased by 2.9% in the quarter, the largest increase since the first quarter of 2012. Following a decline of 0.8% in the first quarter, non-residential business investment edged up 0.2% in the second quarter. Measured on a year-over-year basis, investment in machinery and equipment declined over the past four quarters, while investment in structures flattened.
Final domestic demand rebounded in the second quarter (+0.7%), after remaining unchanged in the first. Nominal GDP, evaluated on an income-basis, increased by 1.0% in the second quarter, down from a first-quarter gain of 1.6% supported by higher prices.
Business sector labour productivity accelerated by 1.8% in the second quarter on broad-based gains across many industrial sectors. Following a decline of 0.1% to start the year, the second quarter gain marked the largest quarterly increase in business sector labour productivity since the first quarter of 1998, as higher output (+1.0%) was accompanied by a 0.8% decrease in hours worked. Business sector labour productivity in Canada has risen 4.3% since the third quarter of 2012, compared with a 1.1% increase in the U.S.Note 3 Year-over-year changes in business sector labour productivity in Canada have exceeded those in the United States in each of the last five quarters.
Industry output advanced in late spring on broad-based gains
Measured on an industry basis, the gross domestic product of goods industries increased by 1.3% during the first half of 2014, outpacing gains in services (+0.9%). Faster growth overall in the second quarter reflected broad-based gains.
In particular, the real output of wholesale and retail industries accelerated during the spring, as both current dollar sales and sales volumes advanced from April to June. Auto output bolstered growth in May.
The output of real estate industries also increased steadily for much of the first half of the year, rising in each of the five months from February to June. Real output in this industry was 1.3% higher in the first half of 2014 than in the second half of 2013.
Construction industries expanded output in late spring, more than offsetting declines in March and April. Residential construction led recent gains. Construction intentions have shown upward momentum in recent months, while housing starts were robust through the second quarter into early summer.
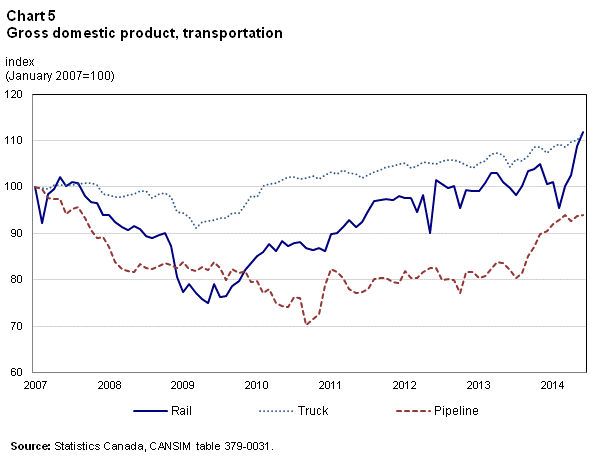
The output of transportation industries also increased throughout the second quarter. Rail transport led gains, while crude oil and other pipeline transportation increased production during May and June.
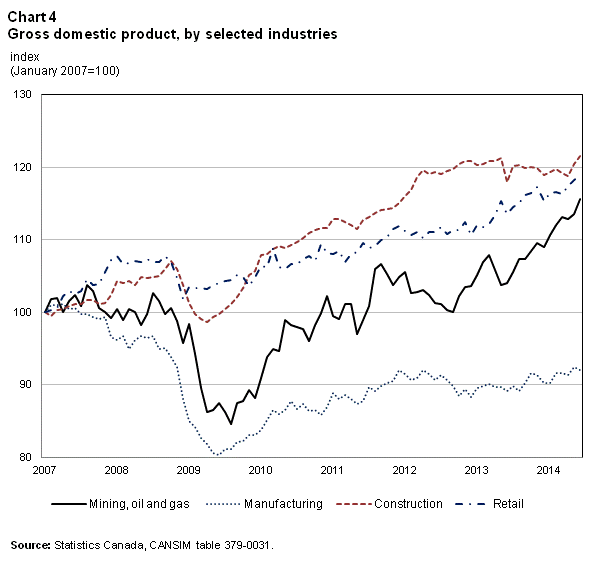
Industrial production increased in late spring, buoyed by gains in the mining and oil and gas extraction sector. Production in this sector has risen in five of the first six months of the year. Conventional and non-conventional oil and gas extraction both expanded production in late spring, after declines in April. Metal ore and non-metallic mineral mining led gains in June.
Manufacturing output was 1.3% higher in the first half of 2014 than during the last half of 2013. Durable manufacturing increased on gains in February and May while non-durables expanded production early in the year and in late spring. Petroleum and coal product manufacturing increased throughout the second quarter.
Employment growth remained subdued during the first half of 2014
Monthly net employment gains averaged 9,000 in the first half of 2014, following an average net increase of 3,000 in the second half of 2013. In 2012, the average net increase in monthly employment was 26,000.
Employment gains in the six months to June (+53,000) were mainly in full-time positions and among workers aged fifty-five or older.
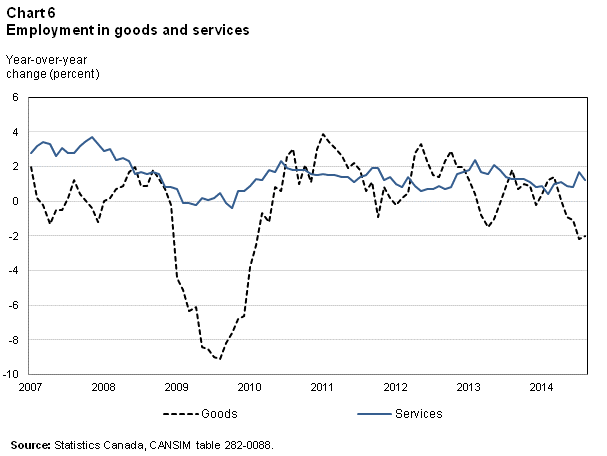
Employment in goods-producing industries declined over the first half of 2014. Employment in services remained steady, supported by increases in the public sector and trade. Self-employed workers accounted for two-thirds of the net increase in employment during this six-month period, while private sector employment growth was essentially flat.
The unemployment rate averaged 7% over the first half of 2014, relatively unchanged from 2013 levels and a full percentage point above pre-recession levels. The average unemployment rate among Western provinces in the first half of 2014 ranged from 4% in Saskatchewan to 6.1% in British Columbia. Among the Atlantic provinces, it ranged from 8.9% in Nova Scotia to 12.1% in Newfoundland and Labrador. The average rate of unemployment during this six-month period stood at 7.4% in Ontario and 7.8% in Quebec.
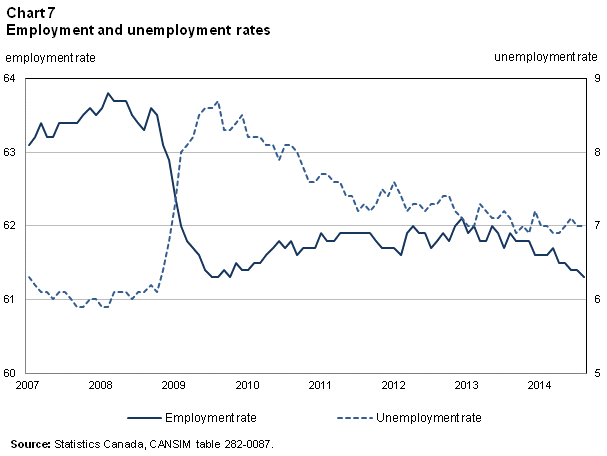
The employment rateNote 4 declined in the first half of 2014, reaching 61.4% in June, the lowest level since the start of 2010. This ratio peaked at 63.8% in February 2008 prior to the last recession, and had averaged 62.7% between 2003 and 2008.
Since 2008, the employment rate has fallen among core-age workers and youth, and risen among workers aged 55 and older. Among core-age workers, the employment rate peaked early in 2008, and fell two percentage points, to 80.6% in June 2014. During this period, this rate among youth declined by 5 percentage points, to 55% as of June 2014. By contrast, the rate among older workers increased in recent years, reaching a record high of 35.7% in June 2014.
Population aging in recent years has had a significant impact on the composition of the labour market, as older workers make up a larger share of full and part-time employment, as well as the unemployed. During the first half of 2014, older workers accounted for 19% of full-time employment, up from 15% in 2008.Note 5 Conversely, the share of full-time employment accounted for by core-age workers declined from 75% to 73%, while youth fell from 10% to 9%.
Trade balance strengthened in the first half of 2014
Canada posted consecutive quarterly trade surpluses in the first half of 2014, reversing a run of quarterly trade deficits dating back to late 2011. On a monthly basis, surpluses were recorded in four of the first six months on the year, as total exports in the first half exceeded imports by $3.7 billion. By comparison, exports trailed imports by $3.7 billion in the last half of 2013, with monthly trade deficits in five out of six months.
The strengthening of the trade position through the first half of 2014 was largely attributable to the increase of the energy surplus, which increased from $37.7 billion in the last half of 2013 to $46 billion in the first half of 2014. These gains reflected higher crude and natural gas export prices during the winter months.
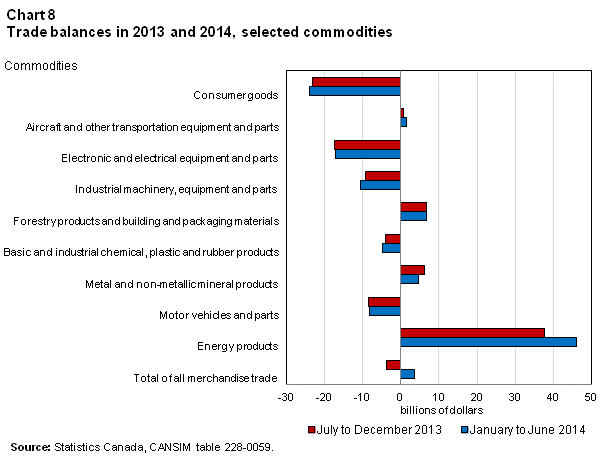
Total exports were 7.8% higher in the first half of 2014 than in the last six months of 2013. Energy exports grew by 15.7% during this period, while non-energy exports increased by 5.2%. After declining in January, non-energy exports saw gains in each of the five months to June. Aircraft and other transportation equipment, along with consumer products, also supported export growth in the first half. The composition of export growth varied between the first and second quarters, as non-energy exports, particularly autos, dominated growth in the second quarter. Exports of motor vehicles and parts were 11.2% higher in the second quarter on strength of higher volumes, while energy exports declined.
Total imports advanced 4.7% in the first half of 2014, with consumer goods, metals and non-metallic minerals, and industrial machinery and equipment contributing to gains. Monthly imports advanced from February to May, before declining in June. Imports of motor vehicles and parts contributed substantially to growth in the second quarter, along with increases in basic and industrial chemicals. Imports of energy products declined in the second quarter, after advancing in the first.
Canada’s trade position strengthened into early summer, as exports in July exceeded imports by $2.6 billion. The increase in the trade surplus from June to July reflected a smaller deficit on motor vehicles and parts, along with a larger surplus for metal and non-metallic minerals. Motor vehicles and parts led export growth in July, while higher imports of these products helped offset a slight decline in total imports.
The terms of trade for merchandise products increased early in 2014 on stronger export prices for energy products, and then retreated in April and May as the price of crude oil and natural gas exports began to decline. The terms of trade as of June were comparable to levels seen though much of 2013.
Manufacturing sales continued to increase in early 2014
Manufacturing sales continued to advance during the first six months of 2014, building on gains in late 2013. Total manufacturing sales were 3% higher during the first half of year than in the second half of 2013.
Sales of non-durable goods advanced by 3.6% in the first half of 2014, led by gains in food industries and petroleum and coal product manufacturers. Food sales increased in four of the first six months of the year. Sales of petroleum and coal products accelerated in late spring, increasing 8% in May and 4.2% in June.
Total sales of durable goods were 2.3% higher in the first six months of 2014 than during the previous six-month period. Gains in the first half reflected higher sales of transportation products and primary metals. Much of the growth in transportation occurred in the spring, as both auto sales and aerospace shipments accelerated in May.
Manufacturing sales increased by 2.5% in July 2014, all on higher volumes. Sales of transportation equipment led the gains, up 10.3% from June. Motor vehicle sales increased by 11.6% in July, while sales of aerospace products and parts rose by 12.2%.
As of July, monthly manufacturing sales stood at $53.7 billion, exceeding the pre-recession peak of $53.2 billion recorded in July 2008.
Retail sales supported by demand for autos
Household spending rose in the first six months of 2014. Retail sales advanced in every month, led by increased spending on autos and building supplies heading into the summer. Gasoline receipts recovered as pump prices rose, while furniture sales were supported by the strength in housing. Demand for clothing and footwear picked up after a colder-than-normal spring, with sales in June posting their largest monthly gain in four years. Conversely, spending on electronics waned heading into the summer, after steady gains to start the year. Overall, sales volumes rose 3.5% in the first half of 2014, following little change in the previous six-month period.
New housing starts accelerate
After a brief dip early in 2014 during severe winter weather, housing starts accelerated heading into the spring and summer months. By July, ground-breaking on new family homes reached 200,000 units (seasonally adjusted at annual rates), supported by a pickup in single family houses which reached the highest level since late in 2012. Multi-family housing recovered after a slow start to the year, hitting 119,000 units in April, the highest level since late in 2012.
Residential building permits rose in five out of the first six months of the year, while the year-over-year change in new house prices remained steady at 1.5%, the slowest pace since outright declines at the end of 2009.
Consumer prices increased on higher costs for food, shelter and transportation
The pace of inflation picked up during the first half of the year, as consumer prices, before adjusting for seasonality, increased by 2.6% in the six months from December 2013 to June 2014. Beginning in April, the year-over-year increase in consumer prices rose above the mid-point of the Bank of Canada’s target range of 1% to 3% for the first time since the spring of 2012. Higher consumer prices observed throughout the spring reflected rising costs for food, shelter and transportation. The gap between the growth in average hourly earnings and annual inflation narrowed.
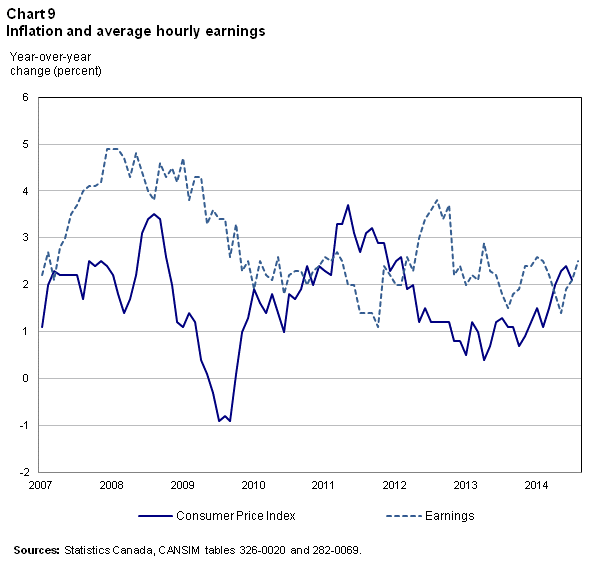
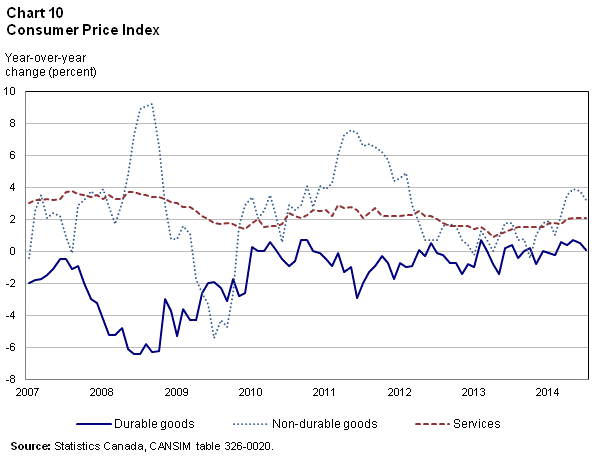
During the first half of 2014, prices for non-durable goods increased at their fastest half-year pace in over two years, reflecting meat shortagesNote 6, tobacco tax increases and higher gas prices. Durable and semi-durable goods posted little change, while the overall cost of services edged up slightly. Excluding food and energy, the annual rate of inflation of 1.6% in June, was the highest in two years.
Equities strengthened through the first half of 2014
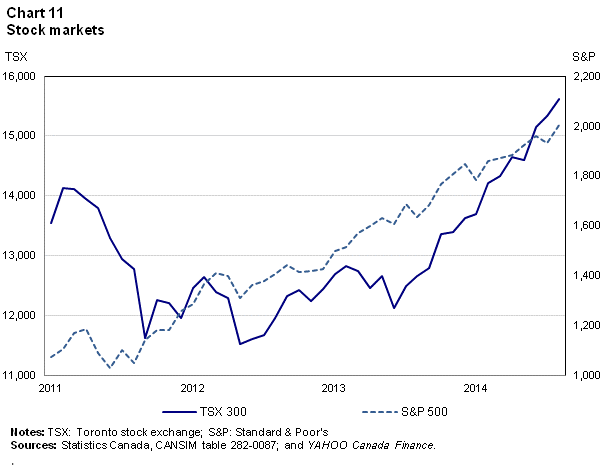
Toronto stock prices rose 11.2% in the six months from December 2013 to June 2014, following a 9.6% overall increase in 2013. Increases in equity prices were broad-based, led by rebounds in the gold and materials indices and steady gains in energy stocks. The materials index posted the largest half-year increase since the end of 2010, while information technology stocks capped two years of rising prices.
The TSX continued to advance into the summer months, gaining a further 3.2% to August, while the U.S. S&P index rose above the 2000 level for the first time.
Commodity prices rallied on the strength of energy in the first half of 2014. Energy prices rose 10.6% in the six months to June as severe winter weather increased demand, before easing 4.9% in July and 4.6% in August. Metals and minerals saw a pickup in prices, supported by some recovery in gold. Agriculture rebounded from a previous drop, while both fish and forestry declined in four out of six months. Forestry prices in July, however, rose at the fastest pace in almost two years, boosted by strength in the U.S. housing market.
From December 2013 to June 2014, demand for household credit rose 2.1%. Mortgage credit growth decelerate while demand for consumer credit increased 1.6%, double the rise in the previous six-month period. Business credit also rose, led by a pickup in short-term credit which expanded at its fastest pace since 2012.
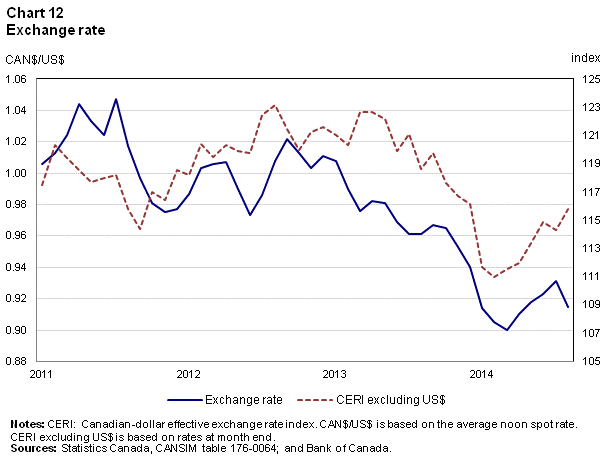
After falling to a recent low of 90 cents in March 2014, the Canadian dollar rallied to 92.3 cents against the U.S. dollar by June and to 93.1 cents in July, before sliding back to 91.5 cents in August. The dollar was last at parity with the U.S. dollar in January 2013. The Canadian dollar also appreciated against the currencies of other major trading partners, namely the Euro and the British pound, over the first half of 2014.
U.S. economy rebounded in the second quarter as employment strengthens in first half of 2014
U.S. GDP rebounded in the second quarter, expanding 4.2% (quarter-to-quarter, annualized), after contracting 2.1% in the first.Note 7 Real GDP in Canada, expressed at an annualized rate, expanded 3.1% in the second quarter of 2014 and 0.9% in the first quarter.
While consumption remained weak in the first half of the year, averaging 0.5% (quarter-to-quarter), business investment accelerated in the second quarter, rising 2%, after little change in the first.
Much of the U.S. growth reflected gains in non-residential investment, notably equipment and buildings, although residential investment increased following two quarters of contraction. U.S. manufacturing sales expanded 1.2% in the second quarter, and new orders increased 2.5%, largely on the strength of durable goods such as transportation equipment. Exports also picked up in the second quarter, with exports of goods and services rebounding 2.4% following a contraction of 2.4% in the first quarter.
U.S. job creation was robust in the first half of 2014, with employers adding, on average, nearly 230,000 workers each month, and only one month (January) falling below the 200,000 mark. The unemployment rate fell from 6.7% in December 2013 to 6.1% in June. However the labour force participation rate, at 62.8%, has shown little movement.
Notes
- Date modified: