
Population Projections for Canada (2018 to 2068), Provinces and Territories (2018 to 2043): Technical Report on Methodology and Assumptions
Chapter 8: Projection of Interprovincial Migration

Archived Content
Information identified as archived is provided for reference, research or recordkeeping purposes. It is not subject to the Government of Canada Web Standards and has not been altered or updated since it was archived. Please "contact us" to request a format other than those available.
by Patrice Dion
Skip to text
Text begins
Introduction
Interprovincial migration is the movement of people between Canada’s provinces and territories. Economically speaking, interprovincial migration is often seen as a positive phenomenon, contributing to balance labour supply and demand. In this regard, interprovincial migration has been facilitated by the Agreement on Internal Trade (AIT), which was signed by most of the provinces and territories in 1994, with the aim of eliminating barriers to trade, investment and labour mobility (Industry Canada 2019).Note
Demographically, for some provinces and territories, interprovincial migration is a key factor in growth and influences the composition of populations. Annually, an average of close to 275,000 people changed their province or territory of residence over the past 10 years. The interprovincial migration rate has decreased slightly over time, from approximately 1.7 per thousand in the 1970s to 0.8 per thousand in the last decade. Population aging seems to account for part but not all of this trend (Dion and Coulombe 2008). In Canada, the reduction of differences in the employment and labour productivity rates between the provinces and territories, following a period of relative prosperity, is also thought to have contributed in part to the decline in interprovincial migration (Basher and Fachin 2008; Coulombe 2006). This pattern has also been observed in the United States (Cooke 2013; Molloy et al. 2011), where it has been associated with several major trends: the increase in the labour force participation rate of women and associated number of dual-earner couples, the increase in debt levels, and the widespread adoption of information and communications technologies. Given that these trends, also present in Canada, are expected to persist, it seems very unlikely that we will witness a return to higher migration rates.
The net interprovincial migration of provinces and territories are more variable than the total interprovincial migration rate, fluctuating largely in response to shifting labour market opportunities (Finnie 2000; Bernard et al. 2008). For example, in the past few years, Alberta attracted many workers, then saw its net migration slump in 2015/2016 and 2016/2017 when crude oil prices fell (Saunders 2018). That being said, the knowledge that interprovincial migration flows fluctuate based on economic variables, such as employment, wages or the price of resources, is actually of little value in projecting future trends, as the future evolutions of these phenomena are highly uncertain and difficult to predict (Makridakis et al. 2009). These considerations largely explain why, among all the components of population growth, interprovincial migration is often the primary source for discrepancies in projected versus actual population evolutions for the individual provinces and territories (Dion and Galbraith 2015). This is why Statistics Canada prefers a pragmatic approach to building assumptions about future interprovincial migration flows, with emphasis on the uncertainty associated with projecting this component.
Methodology
Statistics Canada’s projection model is multiregional; in other words, it classifies individuals not only into cohorts (age) and by sex, but also by place of residence. The multiregional model is used to apply interprovincial migration rates based on origin and destination and ensures that the sum of the inputs is always equal to the sum of the outputs (Rogers 1990). The rates are calculated using historical data, with various scenarios reflecting distinct historical periods. This approach is beneficial, given the lack of strong predictive models, because it captures the essence of the spatial structures that persistently underlie a large majority of migration flows (Ledent 1983; Rogers et al. 2002). In Canada, the degree of linguistic homogeneity (Termote and Fréchette 1980), the spatial configuration of cities and their physical distance (idem. 1980; Simmons 1980), and the economic structure and sociocultural fabric (Simmons 1980) are all factors that determine the migration flows with a certain consistency. This largely explains why the multiregional model has proven superior to other models for projecting internal migration (Snickars and Weibull 1977; Rees 1997). Finally, one advantage of the multiregional model is its matrix formulation, allowing users to add interprovincial migration rates to the rates associated with the other population growth components applied to the cohorts (Le Bras 2008).
However, applying fixed rates in the multiregional model leads to adverse latent effects since projected flows therefore depend only on the size and structure of the regions of origin, regardless of the characteristics of the destination regions (Plane 1993; Le Bras 2008; Dion 2017). In Canada, the use of fixed rates causes a province that grows relatively rapidly, such as Ontario, to see its projected net migration decrease (mechanically) to the benefit of other regions with lower growth, resulting in implausible and converging migration flows in all projection scenarios (Werschler and Nault 1996; Dion 2017). Unfortunately, for the reasons stated above, it is very difficult to project how migration rates will change over time.
For this reason, Statistics Canada implements temporal adjustments over the course of the projection that reflect the differences in relative population growth among the provinces and territories. As a result, the projected net migration and net migration rates of the provinces and territories are more stable, reflecting those observed during the selected historical periods. In addition to providing more transparency, this stability allows interprovincial migration scenarios to be produced with results that are not automatically consistent with the differential growth of the regions, and therefore represent a more plausible range of projection results. Dion (2017) describes the method and its advantages in more detail.
Assumptions
To account for the high uncertainty associated with internal migration projection, five assumptions are proposed, each based on a distinct reference period, and constituting the basis for a distinct scenario. Together, these assumptions demonstrate the high volatility of this component over time. Assumption M1, which can be considered an average scenario to some extent, is based on the longest period for which data are available for all provinces and territories (after the creation of Nunavut), from 1991/1992 to 2016/2017.Note Assumptions M2 to M5 reflect shorter intervals within the aforementioned period. Reference periods were selected so that each province and territory has at least one past period of relatively favourable net interprovincial migration, and another past period of relatively unfavourable net interprovincial migration. Table 8.1 presents the average annual net migration rates recorded during the various reference periods used for the construction of the assumptions.
| Region | 1991/1992 to 2016/2017 period | Average net migration rates for each scenario | ||||||
|---|---|---|---|---|---|---|---|---|
| M1 | M2 | M3 | M4 | M5 | ||||
| Average | Average (-) |
Average (+) |
1991/1992 to 2016/2017 | 1995/1996 to 2010/2011 | 2003/2004 to 2008/2009 | 2009/2010 to 2016/2017 | 2014/2015 to 2016/2017 | |
| percent | ||||||||
| N.L. | -0.49 | -0.67 | -0.27 | -0.49 | -0.62 | -0.29 | 0.04 | -0.07 |
| P.E.I. | -0.10 | -0.22 | 0.01 | -0.10 | -0.12 | -0.36 | -0.25 | -0.05 |
| N.S. | -0.14 | -0.20 | -0.09 | -0.14 | -0.15 | -0.24 | -0.09 | 0.04 |
| N.B. | -0.19 | -0.24 | -0.13 | -0.19 | -0.18 | -0.21 | -0.19 | -0.15 |
| Que. | -0.13 | -0.15 | -0.11 | -0.13 | -0.12 | -0.12 | -0.12 | -0.14 |
| Ont. | -0.03 | -0.06 | 0.00 | -0.03 | -0.01 | -0.12 | -0.03 | 0.03 |
| Man. | -0.39 | -0.43 | -0.34 | -0.39 | -0.36 | -0.43 | -0.38 | -0.43 |
| Sask. | -0.30 | -0.44 | -0.17 | -0.30 | -0.27 | -0.09 | -0.12 | -0.43 |
| Alta. | 0.53 | 0.36 | 0.70 | 0.53 | 0.72 | 0.76 | 0.31 | -0.07 |
| B.C. | 0.24 | 0.08 | 0.37 | 0.24 | 0.05 | 0.26 | 0.22 | 0.46 |
| Y.T. | -0.21 | -0.61 | 0.45 | -0.21 | -0.45 | 0.40 | 0.65 | 0.81 |
| N.W.T. | -0.97 | -1.25 | -0.65 | -0.97 | -1.21 | -1.32 | -0.81 | -0.64 |
| Nvt. | -0.31 | -0.42 | -0.20 | -0.31 | -0.28 | -0.48 | -0.24 | -0.46 |
|
Notes: Average (-) and Average (+) represent average net migration rates recorded in the 1991/1992 to 2016/2017 period excluding, in the case of Average (-), the five years with the highest gains (or lowest losses) and, in the case of Average (+), those with the highest losses (or lowest gains), and this, specifically for each province and territory. Source: Statistics Canada, Demography Division. |
||||||||
Adjustments to the multiregional migration rates mean that the projected average net migration rates are fairly close, but not identical, to the rates observed over the selected reference periods. Indeed, the adjustments help to reduce the gaps related to the effects of population growth (unequal) in the provinces and territories, but do not correct for other effects that may influence migration flows, such as changes in the population age structure. Moreover, the adjustments cannot mathematically guarantee a perfect match with the observed net migration rates, and are instead a compromise to significantly reduce the gaps in all regions equally.
Assumption M1
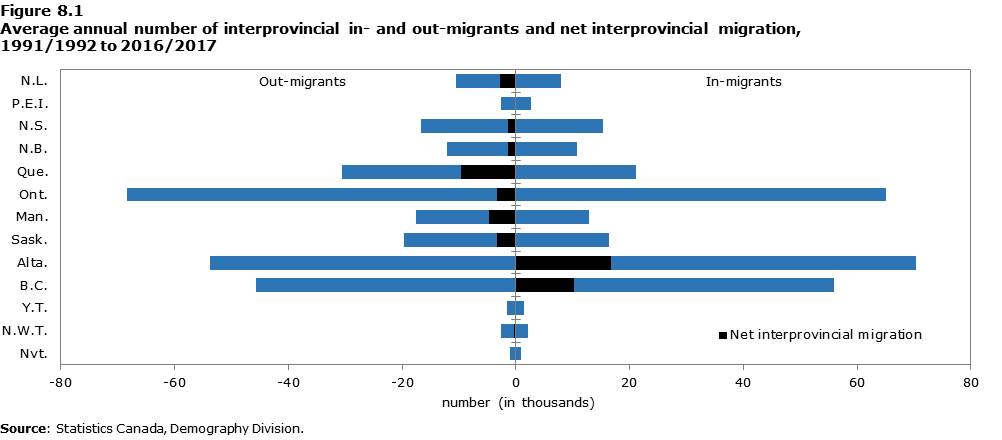
Assumption M1, which could also be referred to as a historical assumption, is based on the past 26 years, from 1991/1992 to 2016/2017. During this period, only Alberta and British Columbia experienced positive net migration (Figure 8.1), while Ontario posted a slightly negative net migration rate.
Description for Figure 8.1
| Region | In-migrants | Out-migrants | Net interprovincial migration |
|---|---|---|---|
| number (in thousands) | |||
| N.L. | 7.9 | -10.6 | -2.8 |
| P.E.I. | 2.6 | -2.7 | -0.1 |
| N.S. | 15.4 | -16.7 | -1.3 |
| N.B. | 10.7 | -12.1 | -1.4 |
| Que. | 21.1 | -30.6 | -9.6 |
| Ont. | 65.0 | -68.3 | -3.3 |
| Man. | 12.9 | -17.5 | -4.7 |
| Sask. | 16.3 | -19.7 | -3.4 |
| Alta. | 70.4 | -53.7 | 16.7 |
| B.C. | 56.0 | -45.7 | 10.3 |
| Y.T. | 1.5 | -1.6 | 0.0 |
| N.W.T. | 2.2 | -2.6 | -0.4 |
| Nvt. | 0.9 | -1.0 | -0.1 |
| Source: Statistics Canada, Demography Division. | |||
Assumption M2
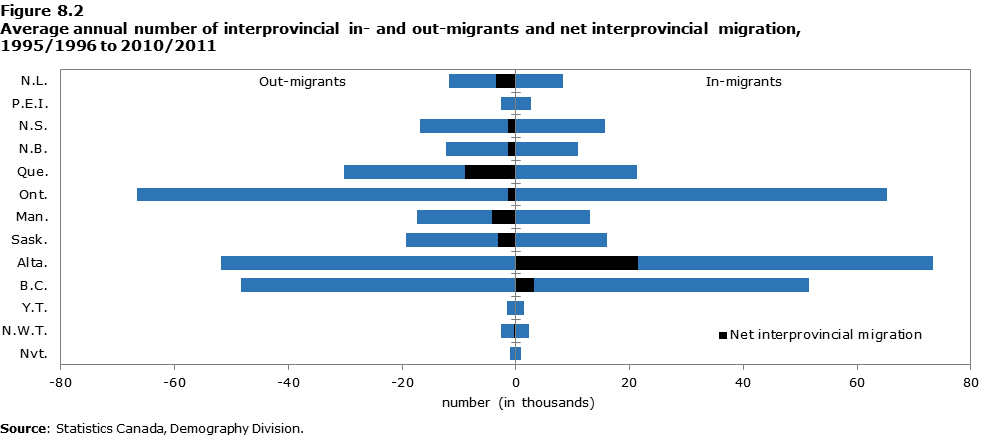
Assumption M2 refers to the years 1995/1996 to 2010/2011. Compared with other periods, these years were relatively favourable to Alberta, Ontario and Manitoba, and relatively unfavourable to Newfoundland and Labrador, British Columbia, Yukon, and the Northwest Territories (Figure 8.2).
Description for Figure 8.2
| Region | In-migrants | Out-migrants | Net interprovincial migration |
|---|---|---|---|
| number (in thousands) | |||
| N.L. | 8.3 | -11.8 | -3.5 |
| P.E.I. | 2.6 | -2.7 | -0.1 |
| N.S. | 15.6 | -16.9 | -1.3 |
| N.B. | 11.0 | -12.3 | -1.3 |
| Que. | 21.3 | -30.3 | -8.9 |
| Ont. | 65.2 | -66.6 | -1.4 |
| Man. | 13.1 | -17.3 | -4.2 |
| Sask. | 16.1 | -19.3 | -3.2 |
| Alta. | 73.3 | -51.9 | 21.4 |
| B.C. | 51.6 | -48.3 | 3.2 |
| Y.T. | 1.5 | -1.5 | -0.1 |
| N.W.T. | 2.3 | -2.7 | -0.4 |
| Nvt. | 0.9 | -1.0 | -0.1 |
| Source: Statistics Canada, Demography Division. | |||
Assumption M3
Assumption M3 is based on the period 2003/2004 to 2008/2009, which was generally unfavourable to the Atlantic provinces and Manitoba. Alberta, British Columbia and Yukon experienced positive net migration during this period (Figure 8.3).

Description for Figure 8.3
| Region | In-migrants | Out-migrants | Net interprovincial migration |
|---|---|---|---|
| number (in thousands) | |||
| N.L. | 8.9 | -11.0 | -2.1 |
| P.E.I. | 2.6 | -3.0 | -0.4 |
| N.S. | 15.3 | -17.5 | -2.3 |
| N.B. | 10.9 | -12.6 | -1.7 |
| Que. | 21.1 | -28.9 | -7.9 |
| Ont. | 58.4 | -72.7 | -14.3 |
| Man. | 12.3 | -17.3 | -5.0 |
| Sask. | 16.5 | -18.6 | -2.1 |
| Alta. | 81.7 | -56.2 | 25.5 |
| B.C. | 54.1 | -43.3 | 10.8 |
| Y.T. | 1.4 | -1.3 | 0.1 |
| N.W.T. | 2.1 | -2.6 | -0.5 |
| Nvt. | 0.9 | -1.0 | -0.2 |
| Source: Statistics Canada, Demography Division. | |||
Assumption M4
Assumption M4 is based on the period from 2009/2010 to 2016/2017, which was characterized by migration flows that, although positive, were relatively less favourable to Alberta (Figure 8.4). This is also a relatively unfavourable scenario for Ontario and Prince Edward Island. Conversely, this period was more favourable than average for Nova Scotia, Saskatchewan, Nunavut and (marginally) Quebec.

Description for Figure 8.4
| Region | In-migrants | Out-migrants | Net interprovincial migration |
|---|---|---|---|
| number (in thousands) | |||
| N.L. | 7.3 | -7.1 | 0.2 |
| P.E.I. | 2.6 | -2.9 | -0.4 |
| N.S. | 14.3 | -15.2 | -0.9 |
| N.B. | 9.8 | -11.2 | -1.5 |
| Que. | 18.7 | -28.1 | -9.4 |
| Ont. | 62.1 | -66.4 | -4.2 |
| Man. | 10.6 | -15.5 | -4.8 |
| Sask. | 16.3 | -17.7 | -1.4 |
| Alta. | 70.4 | -58.2 | 12.2 |
| B.C. | 53.0 | -42.7 | 10.4 |
| Y.T. | 1.4 | -1.2 | 0.2 |
| N.W.T. | 1.8 | -2.2 | -0.4 |
| Nvt. | 0.8 | -0.9 | -0.1 |
| Source: Statistics Canada, Demography Division. | |||
Assumption M5
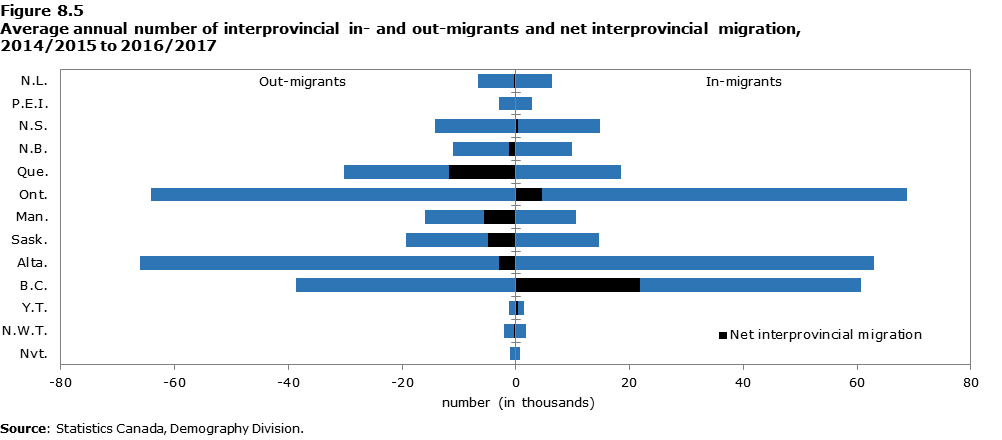
Assumption M5 is based on a short period of three years, from 2014/2015 to 2016/2017. It illustrates the most recent interprovincial migration trends and reflects a substantial departure from general trends in Canada. First, the level of migration to Alberta decreased largely, leading to negative net migration for the province (Figure 8.5). Nunavut and (marginally) Quebec also recorded above-average losses during this period. In contrast, the Atlantic provinces, British Columbia, Yukon and the Northwest Territories experienced more favourable (or less unfavourable) net migration.
Description for Figure 8.5
| Region | In-migrants | Out-migrants | Net interprovincial migration |
|---|---|---|---|
| number (in thousands) | |||
| N.L. | 6.3 | -6.7 | -0.3 |
| P.E.I. | 2.8 | -2.9 | -0.1 |
| N.S. | 14.8 | -14.3 | 0.4 |
| N.B. | 9.9 | -11.0 | -1.2 |
| Que. | 18.5 | -30.3 | -11.8 |
| Ont. | 68.8 | -64.2 | 4.6 |
| Man. | 10.5 | -16.0 | -5.6 |
| Sask. | 14.6 | -19.4 | -4.9 |
| Alta. | 63.0 | -66.0 | -3.0 |
| B.C. | 60.7 | -38.7 | 21.9 |
| Y.T. | 1.5 | -1.2 | 0.3 |
| N.W.T. | 1.8 | -2.1 | -0.3 |
| Nvt. | 0.8 | -1.0 | -0.2 |
| Source: Statistics Canada, Demography Division. | |||
References
Basher, S.A. and S. Fachin. 2008. “The long-term decline of internal migration in Canada – Ontario as a case study”, MPRA Paper, number 6,685.
Bernard, A. R. Finnie and B. St-Jean. 2008. “Interprovincial mobility and earnings”, Perspectives on Labour and Income, volume 9, issue 10, Statistics Canada catalogue no. 75-001-X.
Coulombe, S. 2006. “Internal Migration, Asymmetric Shocks, and Interprovincial Economic Adjustments in Canada”, International Regional Science Review, volume 29, issue 2, pages 199 to 223.
Cooke, T. 2013. “Internal migration in decline”, The Professional Geographer, volume 65, issue 4, pages 664 to 675.
Dion, P. and S. Coulombe. 2008. “Portrait of the mobility of Canadians in 2006: Trajectories and characteristics of migrants”, Report on the Demographic Situation in Canada, Statistics Canada catalogue no. 91-209-X.
Dion, P. and N. Galbraith. 2015. “Back to the future: A review of forty years of population projections at Statistics Canada”, Canadian Studies in Population, volume 42, issue 1-2, pages 102 to 116.
Dion, P. 2017. “An alternative to fixed transition probabilities for the projection of interprovincial migration in Canada”, Population Research and Policy Review, volume 36, issue 6, page 871 to 901.
Finnie, R. 2000. "Who Moves? A Panel Logit Model Analysis of Inter-Provincial Migration in Canada", Analytical Studies Branch Research Paper Series, Statistics Canada catalogue no. 11F0019MPE – no. 142.
Industry Canada. 2019. “Agreement on Internal Trade: Summary of the Agreement”, https://www.ic.gc.ca/eic/site/ait-aci.nsf/eng/h_il00064.html#chap_7.
Le Bras, H. 2008. The Nature of Demography, Princeton NJ, Princeton University Press.
Ledent, J. 1983. “Une analyse log-linéaire des courants migratoires interprovinciaux: Canada, 1961-1983“, Cahiers Québécois de Démographie, volume 12, issue 2, pages 233 to 250.
Makridakis, S., R.M. Hogarth and A. Gaba. 2009. “Forecasting and uncertainty in the economic and business world”, International Journal of Forecasting, volume 25, issue 4, pages 794 to 812.
New West Partnership. 2019. “The Agreement”, http://www.newwestpartnershiptrade.ca/the_agreement.asp.
Molloy, R., C.L. Smith and A. Wozniak. 2011. “Internal Migration in the United States”, The Journal of Economic Perspectives, volume 25, issue 3, pages 173 to 196.
Plane, D.A. 1993. “Requiem for the fixed-transition-probability migrant”, Geographical Analysis, volume 25, issue 3, pages 211 to 223.
Rees, P. 1997. “Problems and solutions in forecasting geographical populations”, Journal of the Australian Population Association, volume 14, issue 2, pages 145 to 166.
Rogers, A. 1990. “Requiem for the net migrant”, Geographical Analysis, volume 22, issue 4, pages 283 to 300.
Rogers, A., F.J. Willekens, J. Little and J. Raymer. 2002. “Describing migration spatial structure“, Papers in Regional Science, volume 81, issue 1, pages 29 to 48.
Saunders, D. 2018. “Internal Migration: Overview, 2015/2016”, Report on the Demographic Situation in Canada, Statistics Canada catalogue no. 91-209-X.
Simmons, J.W. 1980. “Changing migration patterns in Canada 1966-1971 to 1971-1976”, Canadian Journal of Regional Science, volume 3, issue 2, pages 139 to 162.
Snickars, F. and J.W. Weibull. 1977. “A minimum information principle: Theory and practice”, Regional Science and Urban Economics, volume 7, issue 1-2, pages 137 to 168.
Termote, M.G., and R. Fréchette. 1980. “Le renversement récent des courantes migratoires entre les provinces canadiennes, essai d’interprétation”, Canadian Journal of Regional Science, volume 3, issue 2, pages 163 to 192.
Werschler, T. and F. Nault. 1996. “Projecting interregional migration balances within a multiregional cohort-component framework”, Environment and Planning A, volume 58, issue 5, pages 769 to 782.
- Date modified: