


Statistics Canada
www.statcan.gc.ca
Common menu bar links

2002 to 2007

Archived Content
Information identified as archived is provided for reference, research or recordkeeping purposes. It is not subject to the Government of Canada Web Standards and has not been altered or updated since it was archived. Please "contact us" to request a format other than those available.
Section 3: Census divisions
The census divisions (CDs) experiencing the largest increases in the past year
Demographic estimates at July 1, 2007 indicate that of the ten census divisions (CDs) experiencing the largest increases, eight were in Alberta (4) and Quebec (4). The other two CDs were in British Columbia and Manitoba.
Alberta’s Division No. 19, which includes the Grande Prairie and Peace River municipalities, experienced the largest annual population increase (46.6 per thousand) between July 1, 2006 and June 30, 2007 . It just barely surpassed another Alberta CD, Division No. 16, which includes the Fort MacKay and Wood Buffalo municipalities. With a 46.2 per thousand increase, this CD experienced the largest population growth last year. The other two Alberta CDs appearing among the top 10 showing the largest increase are Alberta’s Division No. 8 (Red Deer, Lacombe and Ponoka) (37.1 per thousand) in 4th place and Division No. 6 (Calgary) (35.1 per thousand) in 7th place.
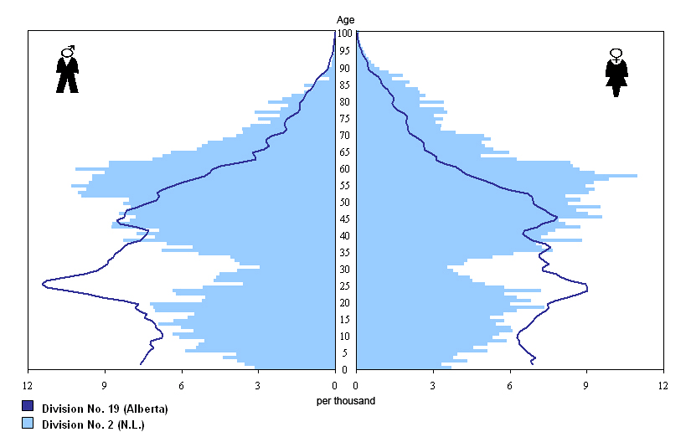
The population growth in Division no. 19 is due mainly to interprovincial migration whereas young people in their twenties, mainly men, are moving to this CD. Between 2001 and 2006, Division no. 19 registered an increase of 2,042 men and 1,219 women aged 20 to 29 mainly due to interprovincial migration. In addition to contributing to the population growth of the CD, the influx of young male also contributed to unbalanced the sex ratio of Division no. 19 (110 male for 100 female). The sex ratio for Canada as a whole is 98 male for 100 female.
The strength of Alberta’s economy accounted partly for the large increases in many of this province’s CDs, which attracted large numbers of migrants from other provinces across Canada.
British Columbia’s Central Okanagan CD ranked 3rd, with an annual population increase of 39.8 per thousand. Its good climate and attractive location among a valley in the Rockies makes it a popular region. With an important regional pole—the City of Kelowna—the Central Okanagan CD attracts migrants of all ages from British Columbia and other parts of Canada.
| Population 2006 (July 1) | Population 2007 (July 1) | Growth | Growth rate | |
|---|---|---|---|---|
| number | per thousand | |||
| Division No. 19, Alberta | 102,210 | 107,090 | 4,880 | 46.6 |
| Division No. 16, Alberta | 55,274 | 57,885 | 2,611 | 46.1 |
| Central Okanagan, British Columbia | 168,179 | 175,010 | 6,831 | 39.8 |
| Division No. 8, Alberta | 177,999 | 184,725 | 6,726 | 37.1 |
| Mirabel, Quebec | 35,474 | 36,801 | 1,327 | 36.7 |
| Division No. 2, Manitoba | 59,412 | 61,537 | 2,125 | 35.1 |
| Division No. 6, Alberta | 1,187,620 | 1,230,043 | 42,423 | 35.1 |
| La Jacques-Cartier, Quebec | 30,593 | 31,677 | 1,084 | 34.8 |
| Vaudreuil-Soulanges, Québec | 122,274 | 126,383 | 4,109 | 33.0 |
| Les Moulins, Quebec | 131,773 | 136,123 | 4,350 | 32.5 |
Quebec’s Mirabel (36.7 per thousand, 5th place), La Jacques-Cartier (34.8 per thousand, 8th place), Vaudreuil-Soulanges (33.1 per thousand, 9th place) and Les Moulins (33.0 per thousand, 10th place), as well as Manitoba’s Division No. 2 (Hanover, Steinbach and Taché) (32.5 per thousand, 6th place) CDs rounded out the list.
Located next to Montréal, Quebec’s Mirabel, Vaudreuil-Soulanges and Les Moulins CDs owed most of their population growth to Montréal’s urban sprawl. Manitoba’s Division No. 2 had the same experience with Winnipeg, as did the La-Jacques-Cartier CD with Quebec City.
Seven of these ten CDs were also among the ten CDs with the largest annual population increases last year. The Central Okanagan CD, Division No. 2 in Manitoba and La-Jacques-Cartier joined the ranks of the CDs with the largest population increases, squeezing out Ontario’s Peel (16th place in 2007) and York (13th place in 2007), and Alberta’s Division No. 18 (12th place in 2007).
The census divisions experiencing the largest decreases in the past year
Demographic estimates at July 1, 2007 indicate that six of the ten CDs experiencing the largest decreases in the past year were located in Newfoundland and Labrador. Three of the four other CDs were situated in British Columbia and the other one in Manitoba.
British Columbia’s Stikine (Liard River 3) (-28.1 per thousand) CD posted the largest decrease of all. It replaced Manitoba’s Division No. 16 (Roblin and Russell) as the CD with the largest annual population decrease. Two other British Columbia CDs, Northern Rockies (-21.3 per thousand, 6th place) and Central Coast (Bella Bella 1) (-17.4 per thousand, 10th place) also appeared on this list. Manitoba’s Division No. 4 (Lorne and Pembina) (-19.2 per thousand, 9th place) rounded out the list.
Most of the CDs presenting large decreases are located in the rural or remote regions. They mainly are losing population to major centres with more economic activity.
| Population 2006 (July 1) | Population 2007 (July 1) | Growth | Growth rate | |
|---|---|---|---|---|
| number | per thousand | |||
| Stikine, British Columbia | 1,298 | 1,262 | -36 | -28.1 |
| Division No. 2, Newfoundland and Labrador | 22,331 | 21,724 | -607 | -27.6 |
| Division No. 8, Newfoundland and Labrador | 39,307 | 38,273 | -1,034 | -26.7 |
| Division No. 3, Newfoundland and Labrador | 17,852 | 17,392 | -460 | -26.1 |
| Division No. 9, Newfoundland and Labrador | 18,330 | 17,921 | -409 | -22.6 |
| Northern Rockies, British Columbia | 6,262 | 6,130 | -132 | -21.3 |
| Division No. 4, Newfoundland and Labrador | 21,174 | 20,760 | -414 | -19.7 |
| Division No. 7, Newfoundland and Labrador | 35,513 | 34,823 | -690 | -19.6 |
| Division No. 4, Manitoba | 9,618 | 9,435 | -183 | -19.2 |
| Central Coast, British Columbia | 3,775 | 3,710 | -65 | -17.4 |
Among the ten CDs experiencing the largest decrease, seven are located in Newfoundland and Labrador. The decrease of those population are partly due to precarious local economic situations and the appeal of Alberta’s economic outlook.
The youngest census divisions
For the purposes of this article, median age was used as an indicator of the ageing of a population. The median age is an age "x", such that exactly one half of the population is older than "x" and the other half is younger than "x".
Demographic estimates at July 1, 2007 indicate that 82 CDs (28%) had populations with a median age under the national level (39 years of age). Nunavut and Manitoba had three of the ten youngest CDs. The others were located in Saskatchewan, Alberta, the Northwest Territories and Quebec.
Nunavut’s Keewatin CD was the youngest in Canada, with a median age of 21.5. Next came Saskatchewan’s Division No. 18 (La Loche and La Ronge) (23.3 years), Manitoba’s Division No. 19 (Peguis 1B and Fort Alexander 3) (23.7 years), Nunavut’s Kitikmeot (23.8 years) and Manitoba’s Division No. 22 (Thompson) (23.9 years).
| Median age | Under 18 years | 65 years and over | |
|---|---|---|---|
| year | percentage | ||
| Keewatin, Nunavut | 21.5 | 42.9 | 3.1 |
| Division No. 18, Saskatchewan | 23.3 | 38.8 | 4.9 |
| Division No. 19, Manitoba | 23.7 | 39.0 | 5.9 |
| Kitikmeot, Nunavut | 23.8 | 38.3 | 4.0 |
| Division No. 22, Manitoba | 23.9 | 39.7 | 3.5 |
| Division No. 23, Manitoba | 24.0 | 40.3 | 4.2 |
| Baffin, Nunavut | 24.4 | 37.7 | 2.7 |
| Division No. 17, Alberta | 27.8 | 34.2 | 7.0 |
| Inuvik, Northwest Territories | 28.4 | 32.1 | 6.1 |
| Nord-du-Québec, Quebec | 28.9 | 33.4 | 5.4 |
Among CDs presenting younger population, many are showing the presence of large Aboriginal population. The fertility rate, higher among the aboriginal population than among the non-aboriginal may in part explained the fact that some of those CDs have a median age much lower than Canada’s.
The oldest census divisions
At July 1, 2007, the median age of the population in 206 CDs (63.2%) was higher than Canada’s (39). Most of those CDs were located away from large urban centers.
Five of the ten oldest CDs in Canada were in Quebec. The others were in New Brunswick, British Columbia, Nova Scotia and Ontario.
| Median age | Under 18 years | 65 years and over | |
|---|---|---|---|
| year | percentage | ||
| Haliburton, Ontario | 50.6 | 15.0 | 26.1 |
| Mékinac, Quebec | 49.6 | 15.2 | 21.8 |
| Les Basques, Quebec | 49.2 | 16.5 | 22.3 |
| Les Pays-d'en-Haut, Quebec | 49.2 | 15.1 | 19.8 |
| Okanagan-Similkameen, British Columbia | 48.6 | 16.5 | 25.1 |
| Guysborough, Nova Scotia | 48.3 | 15.1 | 21.8 |
| Charlevoix, Quebec | 48.0 | 15.8 | 19.6 |
| La Haute-Gaspésie, Quebec | 47.8 | 17.3 | 19.7 |
| Sunshine Coast, British Columbia | 47.8 | 16.0 | 20.0 |
| Queens, New Brunswick | 47.7 | 16.6 | 20.8 |
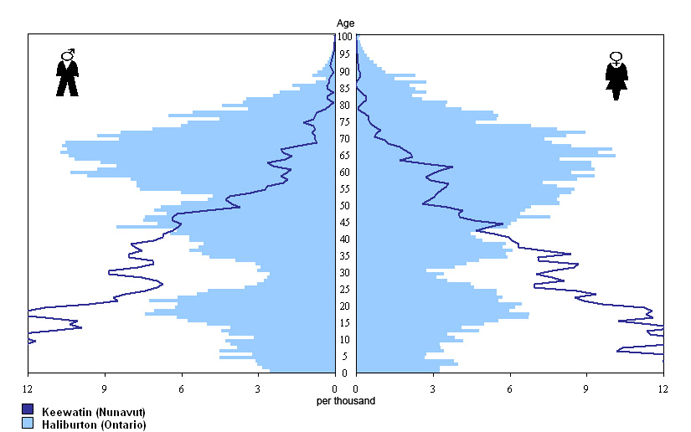
Ontario’s Haliburton was the oldest CD in Canada, with a median age of 50.6. The Haliburton CD with a population of 15,655 presented a net intraprovincial gain of 853 persons among the 50 to 64 age group between 2001 and 2006. This gain contributed to the aging of this CD.
It was followed by three Quebec CDs: Mékinac (49.6 years), Les Pays-d’en-Haut (49.2 years) and Les Basques (49.2 years), all with median ages over 49. British Columbia’s Okanagan – Similkameen (48.6 years) came next, with a median age over 48.
One of the main reasons for the high median age of these census divisions was the out-migration of young adults to the country’s major urban centres. In addition, Sunshine Coast, Charlevoix and Okanagan-Similkameen are regions that, thanks to a gentler climate or the presence of many tourist areas, attracted many older residents. A combination of those two factors, the departure of young adults and the arrival of older people contributed to increase the rate of aging of those CDs.

