


Statistics Canada
www.statcan.gc.ca
Common menu bar links

2002 to 2007

Archived Content
Information identified as archived is provided for reference, research or recordkeeping purposes. It is not subject to the Government of Canada Web Standards and has not been altered or updated since it was archived. Please "contact us" to request a format other than those available.
Section 2: Economic regions
The economic regions (ERs) experiencing the largest increases in the past year
The July 1, 2007 population estimates show that the five ERs that experienced the largest increases since last year were all in Alberta.
The past year’s growth rate for the ten ERs with the largest population increases was well above the 10.0 per thousand growth rate observed for Canada as a whole.
Like last year, the Red Deer ER’s annual population growth was the highest at 37.1 per thousand, ahead of Calgary (35.1 per thousand) and Wood Buffalo – Cold Lake (32.1 per thousand), which ranked second and third, respectively. Three other Alberta ERs ranked among those with the largest annual population growth: Athabasca – Grande Prairie – Peace River (28.6 per thousand), Edmonton (28.0 per thousand) and Lethbridge - Medicine Hat (24.4 per thousand).
The booming of Alberta’s economy contributed to the strong growth in its ERs, which attracted large numbers of migrants from other provinces and territories.
| Population 2006 (July 1) | Population 2007 (July 1) | Growth | Growth rate | |
|---|---|---|---|---|
| number | per thousand | |||
| Red Deer, Alberta | 177,999 | 184,725 | 6,726 | 37.1 |
| Calgary, Alberta | 1,187,620 | 1,230,043 | 42,423 | 35.1 |
| Wood Buffalo - Cold Lake, Alberta | 120,872 | 124,820 | 3,948 | 32.1 |
| Athabasca - Grande Prairie - Peace River, Alberta | 246,710 | 253,868 | 7,158 | 28.6 |
| Edmonton, Alberta | 1,096,153 | 1,127,302 | 31,149 | 28.0 |
| Thompson - Okanagan, British Columbia | 509,034 | 521,903 | 12,869 | 25.0 |
| Lethbridge - Medicine Hat, Alberta | 261,438 | 267,901 | 6,463 | 24.4 |
| Nunavut, Nunavut | 30,400 | 31,113 | 713 | 23.2 |
| Southeast, Manitoba | 97,238 | 99,427 | 2,189 | 22.3 |
| Lanaudière, Québec | 435,491 | 445,188 | 9,697 | 22.0 |
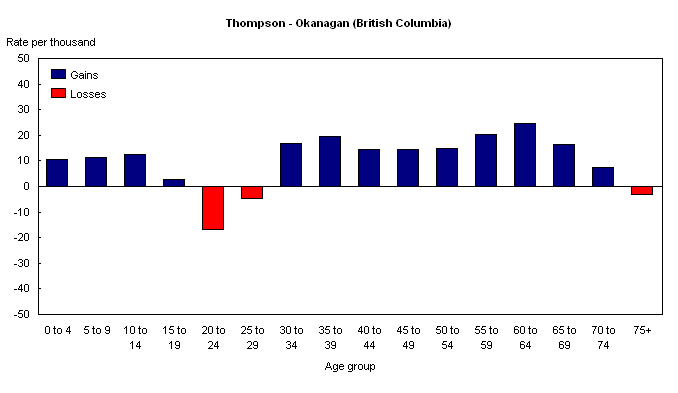
British Columbia’s Thompson – Okanagan ER experienced annual population growth of 25.0 per thousand, placing it in sixth place. This growth was essentially a result of large intraprovincial and interprovincial migration, especially among people in their thirties and fifties. Strong local economic development, good weather and magnificent landscapes made the region particularly appealing to Canadian migrants.
The Nunavut ER ranked 7th, with annual population growth of 23.2 per thousand. This growth was partly due to very high natural growth stemming from a birth rate above the national average.
Manitoba’s Southeast (22.3 per thousand) and Quebec’s Lanaudière (22.0 per thousand) ERs came in 9th and 10th, respectively. Urban sprawl was part of the reason for the growth recorded in these ERs, which are located at the outskirts of Winnipeg and Montréal.
Eight of these ten ERs were also among the ten that posted the highest population growth last year. Only British Columbia’s Lower Mainland – Southwest (ranked 21th in 2007), which includes the city of Vancouver, and Ontario’s Toronto (ranked 19th in 2007) were not among this year’s ten ERs with the highest population growth. Nunavut and British Columbia’s Thompson – Okanagan ERs joined the ranks instead.
The economic regions experiencing the largest decreases in the past year
Population estimates at July 1, 2007 indicate that six of the ten ERs with the largest population decreases since last year were in the Maritimes. The other four ERs were in Ontario, Manitoba and British Columbia.
Like last year, Newfoundland and Labrador’s South Coast - Burin Peninsula ER experienced the largest population decrease of all, with a negative growth of –26.9 per thousand. Two other Newfoundland and Labrador ERs were among those with the largest population decreases: Notre Dame - Central Bonavista Bay in 2nd place (-17.6 per thousand) and West Coast - Northern Peninsula – Labrador in 6th place (-11.0 per thousand).
The population decreases between July 1, 2006 and July 1, 2007 in these ERs can be partly attributed to precarious local economic conditions and Alberta’s strong appeal. Between 2001 and 2006, 19,954 people moved from Newfoundland and Labrador to Alberta, representing 34.24 % of all interprovincial migrants from the eastern province.
Three other ERs in the Maritimes, Campbellton – Miramichi (-12.4 per thousand, 4th place), Edmundston – Woodstock (-7.8 per thousand, 10th place) in New Brunswick and Cape Breton in Nova Scotia (-10.4 per thousand, 7th place) rounded out the list.
The size of the local economy, combined with the appeal of the urban centres located in their own and neighbouring provinces, contributed to the population decreases in these three ERs.
| Population 2006 (July 1) | Population 2007 (July 1) | Growth | Growth rate | |
|---|---|---|---|---|
| number | per thousand | |||
| South Coast - Burin Peninsula, Newfoundland and Labrador | 40,183 | 39,116 | -1,067 | -26.9 |
| Notre Dame - Central Bonavista Bay, Newfoundland and Labrador | 111,211 | 109,267 | -1,944 | -17.6 |
| Northwest, Ontario | 239,999 | 236,890 | -3,109 | -13.0 |
| Campbellton - Miramichi, New-Brunswick | 165,323 | 163,289 | -2,034 | -12.4 |
| Nechako, British Columbia | 42,335 | 41,869 | -466 | -11.1 |
| West Coast - Northern Peninsula - Labrador, Newfoundland and Labrador | 107,564 | 106,387 | -1,177 | -11.0 |
| Cape Breton, Nova-Scotia | 144,883 | 143,379 | -1,504 | -10.4 |
| Parklands, Manitoba | 43,160 | 42,774 | -386 | -9.0 |
| North Coast, Newfoundland and Labrador | 59,678 | 59,150 | -528 | -8.9 |
| Edmundston - Woodstock, New-Brunswick | 83,967 | 83,317 | -650 | -7.8 |
British Columbia’s Nechako (-11.1 per thousand, 5th place) and North Coast (-8.9 per thousand, 9th place) ERs posted net intraprovincial migration losses because of their remoteness from the major centres and the size of their local economies.
Ontario’s Northwest (-13.0 per thousand, 3rd place) and Manitoba’s Parklands (-9.0 per thousand, 8th place) rounded out the list. The population decreases in these two ERs were partly due to net losses from interprovincial migration.
Eight of these ten ERs were also among those with the largest population decreases last year. Saskatchewan’s Swift Current – Moose Jaw (49th place in 2007) and Yorkton – Melville (59th place in 2007) did not make it to this year’s list. The inflow of more migrants from other provinces, mainly Alberta, accounted for the larger population growths in these ERs compared to the previous year.
The youngest economic regions
For the purposes of this article, median age was used as an indicator of the ageing of a population. The median age is an age "x", such that exactly one half of the population is older than "x" and the other half is younger than "x".
Population estimates at July 1, 2007 indicate that 10 ERs (13.2 %) had populations with median ages below 35. These ERs were significantly younger than the Canadian population overall, where the median age was 39.
Three of the ten ERs with the lowest median ages were in Alberta. The others were in Saskatchewan, Nunavut, Manitoba, Quebec, the Northwest Territories and British Columbia.
| Median age | Under 18 years | 65 years and over | |
|---|---|---|---|
| year | percentage | ||
| Northern, Saskatchewan | 23.3 | 41.6 | 4.7 |
| Nunavut, Nunavut | 23.5 | 41.7 | 2.3 |
| North, Manitoba | 25.9 | 37.6 | 5.2 |
| Nord-du-Québec, Quebec | 28.9 | 34.3 | 4.7 |
| Northwest Territories, Northwest Territories | 31.1 | 30.2 | 4.2 |
| Wood Buffalo - Cold Lake, Alberta | 31.7 | 28.6 | 6.5 |
| Athabasca - Grande Prairie - Peace River, Alberta | 32.7 | 28.7 | 9.3 |
| Northeast, British Columbia | 33.1 | 27.5 | 7.7 |
| South Central, Manitoba | 33.5 | 28.5 | 14.2 |
| Red Deer, Alberta | 34.7 | 23.9 | 9.3 |
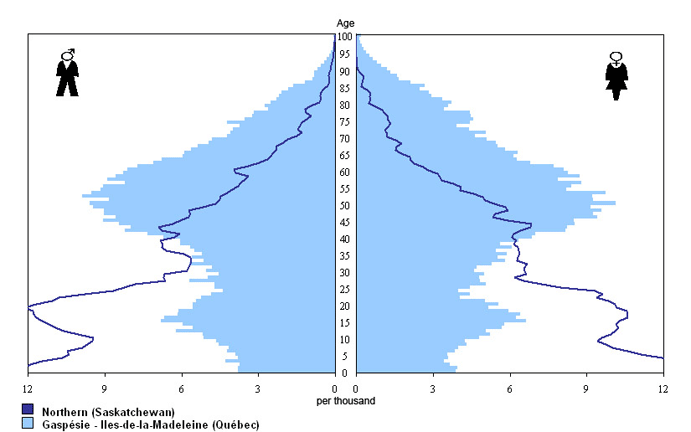
Saskatchewan’s Northern ER, which includes the municipalities of La Ronge and La Loche, was Canada’s youngest, with a median age of 23.3. The Nunavut ER ranked second, with a median age of 23.5, followed by Manitoba’s North (25.9 years), Quebec’s Nord-du-Québec (28.9 years) and the Northwest Territories’ Northwest Territories (31.1 years) ERs.
Large Aboriginal populations, with their higher fertility rate, partly accounted for the low median ages in these economic regions.
The oldest economic regions
At July 1, 2007, the median age posted for 40 ERs (52.6 %) was at least 40.
Quebec had three of the ten oldest ERs in Canada. The other oldest ERs were in British Columbia, Newfoundland and Labrador, Saskatchewan, Nova Scotia, Ontario and New Brunswick.
Quebec’s Gaspésie – Îles-de-la-Madeleine was Canada’s oldest ER, with a median age of 46.2. Two other ERs, Mauricie in Quebec and South Coast - Burin Peninsula in Newfoundland and Labrador had populations with median ages just over 45. These were followed by Quebec’s Bas-Saint-Laurent (44.9 years) and Newfoundland and Labrador’s Notre Dame - Central Bonavista Bay (44.7 years) ERs.
Emigration by young people to other parts of Canada accentuated the high median ages of these economic regions.
| Median age | Under 18 years | 65 years and over | |
|---|---|---|---|
| year | percentage | ||
| Gaspésie - Îles-de-la-Madeleine, Québec | 46.2 | 17.2 | 18.2 |
| Mauricie, Québec | 45.1 | 17.4 | 18.2 |
| South Coast - Burin Peninsula, Newfoundland and Labrador | 45.0 | 18.1 | 14.9 |
| Bas-Saint-Laurent, Québec | 44.9 | 18.1 | 17.3 |
| Notre Dame - Central Bonavista Bay, Newfoundland and Labrador | 44.7 | 18.0 | 17.0 |
| Yorkton - Melville, Saskatchewan | 44.6 | 21.4 | 21.6 |
| Southern, Nova Scotia | 44.4 | 17.7 | 18.0 |
| Kootenay, British Columbia | 44.4 | 18.9 | 16.8 |
| Muskoka - Kawarthas, Ontario | 44.4 | 18.9 | 19.1 |
| Campbellton - Miramichi, New Brunswick | 44.2 | 17.7 | 16.0 |
Internal migration: the key factor in the increase or decrease of Canadian ERs
Demographic estimates from July 1, 2006 to July 1, 2007 confirm that internal migration, which consists of intraprovincial migration (within a given province or territory) and interprovincial migration (between provinces or territories), is the key factor in population increases or decreases in Canada’s ERs.
Internal migration was the main factor driving population increases and decreases in almost two-thirds of Canada’s ERs.
For 22 of the country’s 76 ERs (28.9 %), intraprovincial migration was the key factor in the region’s population increase or decrease, and for 28 ERs (36.8 %), it was interprovincial migration.
Intraprovincial migration accounted for a particularly significant portion of the increase in Quebec’s Lanaudière (17.8 per thousand) and Laurentides (12.9 per thousand) ERs, and had a negative impact on population growth in the Montréal (-14.7 per thousand) ER. This stemmed from Montréal’s urban sprawl, which benefited the neighbouring municipalities belonging to the Lanaudière and Laurentides ERs.
Intraprovincial migration slowed the population growth in Alberta’s Wood Buffalo – Cold Lake ER (-16.9 per thousand). Nonetheless, the Wood Buffalo – Cold Lake population increased between July 1, 2006 and July 1, 2007, mainly because of the impact of interprovincial migration (34.8 per thousand).
The growth of the Newfoundland and Labrador South Coast - Burin Peninsula ER population was the one most severely impeded by interprovincial migration (-14.3 per thousand). Out-migration to Alberta accounted for part of this phenomenon.
Internal migration within ERs: a new portrait
The growth and demographic structure of almost two-thirds of Canada’s economic regions is mainly driven by internal migration. Therefore, the demographic characteristics of internal migrants have a major impact on the demographies of Canada’s ERs. Grouping them according to their appeal to internal migrants depending on their age yields a different perspective on their demographic structures.
Eight categories of ERs have been identified based on the characteristics of internal migrants who leave or move to the ERs: major metropolises, regional metropolises, suburbs, regional poles, tourist regions, remote regions, oil regions and the Far North.
Note: For analytical purposes, this typology is based on an ER’s appeal according to the age of the internal migrants, not according to the size of the population or economy. As with every typology, the classification of some of the ERs may be subject to debate.
The eight categories into which Canada’s ERs have been grouped are defined as follows:
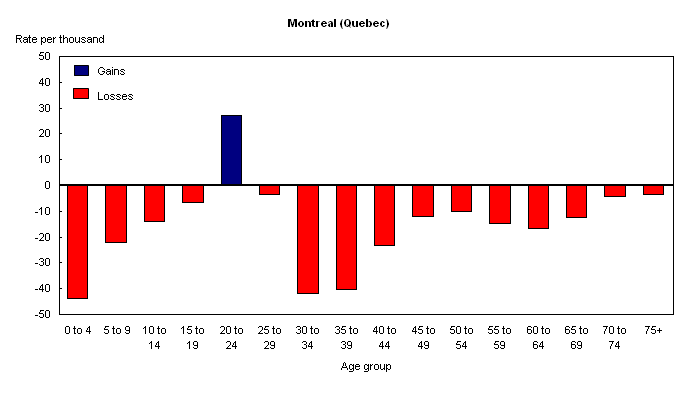
- Type I: the major metropolises. These major urban centres, which have strong economies, attract many young adults in their early twenties. However, these major metropolises may have difficulty retaining people in their thirties because of the strong draw of the suburbs neighbouring these major metropolises. The Montréal and Toronto economic regions are examples of major metropolises.
- Type II: the regional metropolises. These urban areas, which are generally smaller than major metropolises but nonetheless have strong economies and universities, also attract young adults, although their appeal is weaker than that of the major metropolises. They also have difficulty retaining adults in their thirties and forties, although less so than the major metropolises. The Fredericton - Oromocto and London economic regions are examples of regional metropolises.
- Type III: the suburbs. These economic regions, most of which are located around the major metropolises, experience large population growths from internal migration. They tend to lose young adults in their twenties to the major metropolises, but also attract many people in their thirties. Quebec’s Montérégie and Manitoba’s Southeast economic regions are examples of suburbs.
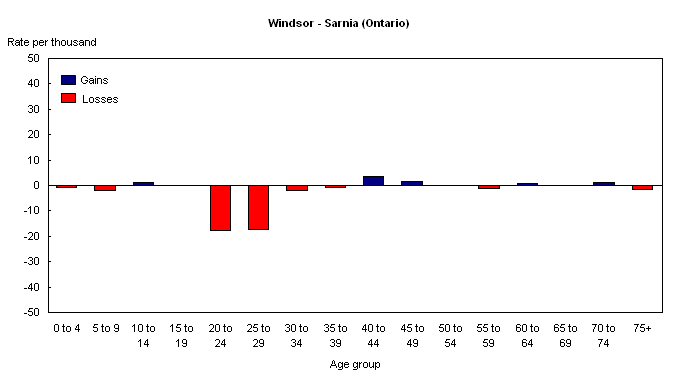
- Type IV: the regional poles. While these regions are generally situated far from major metropolises, they include a city with healthy economic activity. Thus, these regions tend to lose young people in their twenties to the more cosmopolitan regions, but they gain adults in their thirties because of their economic activity. Ontario’s Windsor – Sarnia and Manitoba’s Southwest economic regions are examples of regional poles.
- Type V: the tourist regions. These economic regions are characterized by the presence of extensive tourism and generally good weather. Although they tend to lose young adults, they gain people in their fifties and sixties. The Thompson – Okanagan and Muskoka – Kawarthas economic regions are examples of tourist regions.
- Type VI: the remote regions. These economic regions, which are normally situated far from the major metropolises, are characterized by the out-migration of young adults and their general difficulty in attracting migrants, regardless of their age. The Cape Breton and Gaspésie - Îles-de-la-Madeleine economic regions are examples of remote regions.
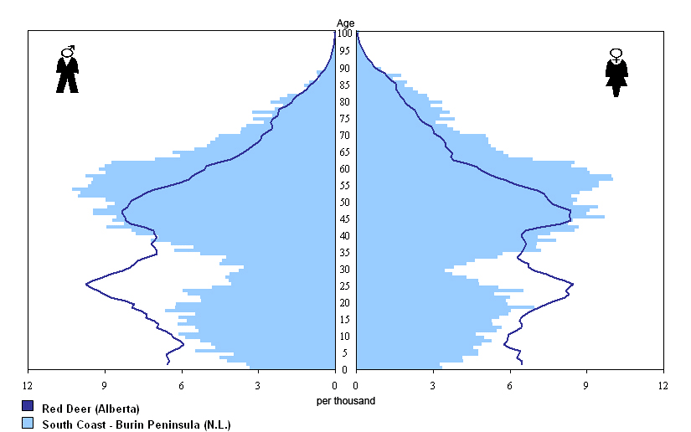
- Type VII: the oil regions. These economic regions, all of which are situated in Alberta, attract migrants of all ages, largely because of their strong economic activity, driven by the oil industry. This appeals particularly to young adults in their twenties. The Red Deer and Calgary economic regions are examples of oil regions.
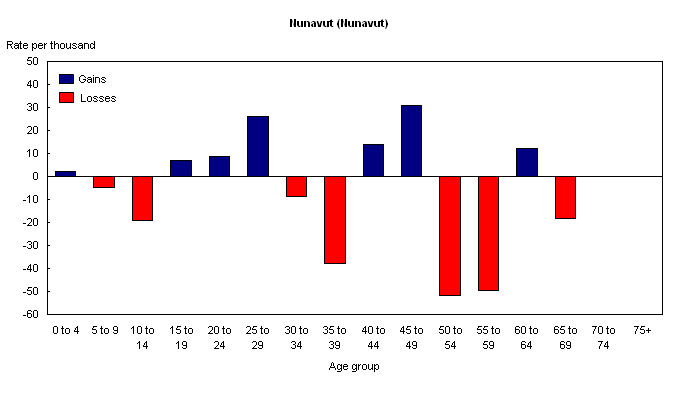
- Type VIII: the Far North regions. These regions, located in northern Canada, are characterized by strong variations in their internal migration. The Nunavut and Northern economic regions are examples of Far North regions.
Type I: The major metropolises appeal to young adults
Because of their strong economies and their colleges and universities, Canada’s major metropolises are tremendously attractive to young adults. From 2001 to 2006, these regions accumulated a net surplus of 51,147 individuals between 20 and 24 years of age, representing an annual net internal migration rate of 11.6 per thousand. At the same time, they posted net losses of 56,900 individuals between 30 and 34 years of age, which is equivalent to an annual net internal migration rate of -11.5 per thousand.
The Montréal, Halifax and the Capitale-Nationale—which includes Quebec City—ERs are particularly attractive to young adults aged 20-24, many of whom move to these big cities and make up a large proportion of their populations.
Some of the major metropolises have difficulty retaining migrants once they reach their thirties. This is particularly true for the Montréal ER, which loses many people aged 30 to 49 through intraprovincial migration to the surrounding areas. Between 2001 and 2006, Montréal lost a net total of 123,071 people in its migratory exchanges with the other Quebec ERs.
Type I: the major metropolises
Capitale-Nationale, Quebec
Halifax,
Nova Scotia
Lower Mainland – Southwest, British Columbia
Toronto,
Ontario
Winnipeg, Manitoba
Montréal, Quebec
Ottawa ,
Ontario
In this group, only the Capitale-Nationale (+ 8,033), Halifax (+ 826) and Ottawa (+5,693) ERs experienced positive internal net migration between 2001 and 2006.
Between 2001 and 2006, the Toronto (104.9 per thousand) and Lower Mainland – Southwest (81.2 per thousand)—surrounding Vancouver—ERs experienced much larger population growth than Canada’s other major metropolises. However, this increase was mainly due to international migration, not to internal migration.
Type II: Young adults are also moving to the regional metropolises
Like Canada’s major metropolises, the regional metropolises attract young adults because of their economic strength and academic institutions. However, the draw of regional metropolises is not as strong as that of the major metropolises. Between 2001 and 2006, these regions posted a total net surplus of 3,267 individuals between 20 and 24 years of age, compared to net losses of 4,443 individuals aged 25 to 29.

Type II: the regional metropolises
Lethbridge - Medicine Hat,
Alberta
Moncton – Richibucto, New Brunswick
London, Ontario
Fredericton
– Oromocto, New Brunswick
Saskatoon – Biggar, Saskatchewan
Banff
- Jasper - Rocky Mountain House, Alberta
New Brunswick’s Fredericton – Oromocto and Ontario’s London ERs attract many young people between 20 and 24 years of age because of their post-secondary academic institutions.
The growth of Moncton, New Brunswick has generated a significant amount of intraprovincial migration to the Moncton – Richibucto ER.
Alberta’s Lethbridge – Medicine Hat is an unusual ER when compared to the province’s other ERs because this region does not attract young people in their late 20s. This may be due to the unique economic situation in Alberta, which draws young workers to other regions in this province.
Alberta’s Banff – Jasper – Rocky Mountain House ER is a special case. Despite the lack of academic institutions, the region attracts many young people aged 15 to 24 from other provinces, and at the same time loses adults in their late 20s. This region’s special geographic situation, which includes several ski centres in the Rockies, accounts for this unique migratory phenomenon, whereby many young people move there to take advantage of its particular geography but later leave when the time comes to settle down.
Type III: Booming suburbs
The ERs ringing the country’s major metropolises are experiencing tremendous population growth as a result of urban sprawl. Between 2001 and 2006, their populations increased by 63.3 per thousand.
Quebec’s Laurentides (95.8 per thousand) and Lanaudière (94.6 per thousand) ERs, Manitoba’s Southeast (87.7 per thousand) and Ontario’s Kitchener - Waterloo – Barrie (80.4 per thousand) ER are among the ten ERs with the largest population growth between 2001 and 2006. The Laurentides and Lanaudière ERs ring Montréal, and the Southeast and Kitchener – Waterloo – Barrie ones are next to Winnipeg and Toronto, respectively.
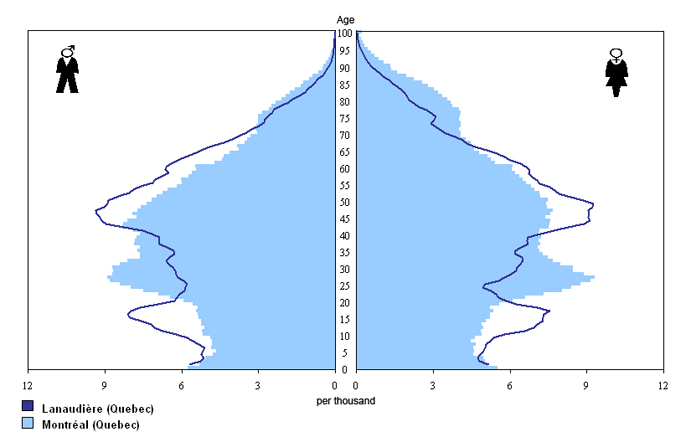
Between 2001 and 2006, the contribution of intraprovincial migration to the population growth of the Lanaudière and Laurentides ERs was particularly significant, boosting their populations by 32,846 and 37,406. This is partly attributed to the fact that many Montréal residents decided to move to these two ERs.
The particularly high influx of individuals in their thirties and forties who moved from the major metropolises to the peripheral regions accounted for the large population growth in these ERs despite the move of young adults aged 20 to 24 from these regions to the same major metropolises.

Type III: the suburbs
Lanaudière, Quebec
Interlake,
Manitoba
Laval, Quebec
Laurentides, Quebec
Southeast, Manitoba
Montérégie,
Quebec
Kitchener - Waterloo – Barrie, Ontario
Camrose –
Drumheller, Alberta
Hamilton - Niagara Peninsula, Ontario
Outaouais,
Quebec
North Central, Manitoba
Annapolis Valley , Nova Scotia
Type IV: The regional poles attract older workers
Notwithstanding a rather slight population increase between 2001 and 2006, several ERs located around major regional poles tend to attract workers in their thirties and forties from other regions in the province because of their economic activity. However, this attraction is less pronounced than that of the regional metropolises.
Quebec’s Mauricie ER, which includes the city of Trois-Rivières, Newfoundland and Labrador’s Avalon Peninsula ER, which includes the city of St. John's, and Manitoba’s Southwest ER, whose largest city is Brandon, owe much of their population growth between 2001 and 2006 to people over 40 moving into these regions.
The Avalon Peninsula ER posted a positive net internal migration of 587 individuals between 2001 and 2006. Notwithstanding a negative net interprovincial migration loss of 4,425 people, this ER nonetheless had a positive net intraprovincial migration of 5,012 individuals.
From 2001 to 2006, the Regina – Moose Mountain ER lost a net total 7,568 people to other parts of Canada, the largest loss in proportion to total population. This ER’s losses are in part attributable to the appeal of Alberta’s strong economy.
In addition to the economic weight of the largest cities in these ERs, their wide range of services makes them very attractive to older people.
Type IV: the regional poles
Southwest, Manitoba
Mauricie,
Quebec
Avalon Peninsula, Newfoundland and Labrador
Chaudière
– Appalaches, Quebec
Windsor – Sarnia, Ontario
Regina -
Moose Mountain, Saskatchewan
Saint John - St. Stephen, New Brunswick
Type V: Retirees attracted by the tourist areas
Between 2001 and 2006, the population growth in British Columbia’s Thompson – Okanagan (50.4 per thousand) and Vancouver Island and Coast (38.8 per thousand), Quebec’s l’Estrie (37.3 per thousand) and Ontario’s Muskoka – Kawarthas (33.3 per thousand) ERs was in part attributable to the influx of internal migrants aged 50 to 64 in spite of the loss of young adults in their twenties.
Type V: the tourist regions
Thompson – Okanagan, British
Columbia
Muskoka – Kawarthas, Ontario
Estrie, Quebec
Vancouver
Island and Coast, British Columbia
Centre-du-Québec, Quebec
Kingston
– Pembroke, Ontario
Stratford - Bruce Peninsula, Ontario
North
Shore, Nova Scotia
Southern, Nova Scotia
Prince Edward Island
Between 2001 and 2006, Thompson – Okanagan experienced a net migration of 9,590 people aged 50 to 64 from other parts of Canada. This influx of individuals nearing retirement age accounted for the growth in this ER’s population despite the loss of 1,912 individuals aged 15 to 29.
The Muskoka – Kawarthas economic region experienced the same phenomenon, with an influx of 7,916 people aged 50 to 64 increasing its population despite the loss of 3,027 people aged 15 to 29.
Thompson – Okanagan and Muskoka – Kawarthas are regions characterized by their appeal to intraprovincial migrants.
The Vancouver Island and Coast ER, which includes the city of Victoria, was characterized by a particularly large number of interprovincial migrants aged 50 to 64. Between 2001 and 2006, this ER’s net intraprovincial migration was 10,178 compared to 15,804 for its net interprovincial migration. This is in contrast to the other ERs in this category, for which most of the influx of 50 to 64 year-olds came from intraprovincial migration.
These regions appeal particularly to recent retirees, among others, thanks to their many tourist attractions, favourable climate, and services, including hospitals.
Type VI: The remote regions are losing their young people
The more rural economic regions that are located far from major metropolises experienced a population decrease between 2001 and 2006 because of the departure of many young adults and their difficulty in attracting migrants of all ages. In general, these ERs experienced a population decrease of 31.0 per thousand between 2001 and 2006, as young adults aged 20 to 24 posted an annual net internal migration rate of -49.3 per thousand.
Newfoundland and Labrador’s South Coast - Burin Peninsula (-101.4 per thousand), British Columbia’s North Coast (-88.8 per thousand), Saskatchewan’s Yorkton – Melville (-67.1 per thousand), Newfoundland and Labrador’s Notre Dame - Central Bonavista Bay (-56.8 per thousand) and New Brunswick’s Campbellton – Miramichi (-54.3 per thousand) were the five ERs with the largest population decreases between 2001 and 2006. These are all rural regions that are far from major metropolises, with significant losses in terms of adults aged 20 to 24.
Compared to the size of their populations, British Columbia’s North Coast (-7,462 people) and Nechako (-3,182 people) and Newfoundland and Labrador’s South Coast - Burin Peninsula (-4,118 people) ERs were the most affected by the loss of inhabitants to other parts of Canada between 2001 and 2006.
These large population decreases were largely due to the high emigration of young adults in their twenties to more cosmopolitan regions with economies that provided more jobs or post-secondary institutions.

Type VI: the remote regions
Northeast, British Columbia
Bas-Saint-Laurent,
Quebec
Gaspésie - Îles-de-la-Madeleine, Quebec
Kootenay,
British Columbia
West Coast - Northern Peninsula – Labrador, Newfoundland
and Labrador
Swift Current - Moose Jaw, Saskatchewan
Northwest, Ontario
Saguenay
- Lac-Saint-Jean, Quebec
Campbellton – Miramichi, New Brunswick
Cape
Breton, Nova Scotia
Prince Albert, Saskatchewan
South Central, Manitoba
Abitibi
– Témiscamingue, Quebec
Côte-Nord, Quebec
Cariboo,
British Columbia
Notre Dame - Central Bonavista Bay, Newfoundland and Labrador
Parklands,
Manitoba
Edmundston – Woodstock, New Brunswick
South Coast - Burin
Peninsula, Newfoundland and Labrador
Yorkton – Melville, Saskatchewan
Nechako,
British Columbia
North Coast, British Columbia
Nord-du-Québec,
Quebec
Type VII: The oil regions are very attractive to internal migrants
The very favourable economic conditions generated mainly by the booming oil industry contribute to the strong population growths in these regions, all of which are located in Alberta. These regions are also marked by their appeal to migrants of all ages.
Between 2001 and 2006, Alberta’s Red Deer (125.6 per thousand), Calgary (124.8 per thousand), Wood Buffalo – Cold Lake (121.4 per thousand) and Edmonton (90.0 per thousand) ERs were all among the top ten ERs in terms of population growth in Canada.
The Wood Buffalo – Cold Lake ER was most noteworthy because of its negative balance of -4 837 individuals from migratory exchanges with other Alberta regions, and the Red Deer ER was the big winner, with a net surplus of 5,649 people. However, of all of the ERs, Wood Buffalo – Cold Lake was the one that benefited the most from migratory exchanges with Canada’s other provinces, hence its extremely high growth rate.
This very strong growth was driven by the massive influx of individuals from other provinces. These economic regions are particularly attractive to young workers in their twenties wanting to take advantage of the economic boom in these parts of Alberta.

Type VII: the oil regions
Red Deer, Alberta
Athabasca - Grande
Prairie - Peace River, Alberta
Wood Buffalo - Cold Lake, Alberta
Calgary,
Alberta
Edmonton , Alberta
Type VIII: The Far North: natural growth the driving force of population growth
Despite a negative migratory balance, the population grew in the northern regions. These regions are marked by strong variations in their internal migration by age group.
Between 2001 and 2006, Saskatchewan’s Northern ER experienced a 48.4 per thousand increase in its population despite a negative net internal migration of 1,805 people. A natural increase of 102.4 per thousand over this period accounted for the increase in this economic region.
The same applied to Manitoba’s North ER and the Northwest Territories ER which, despite out-migration to Canada’s other regions (-5,393 and –1,401 people, respectively), experienced positive population growth (19.9 per thousand and 38.0 per thousand) thanks to their high natural growth between 2001 and 2006 (81.1 per thousand and 61.5 per thousand).
The population growth in these ERs despite out-migration can be attributed to the higher fertility of Aboriginal people.
Type VIII: the Far North
Yukon Territory, Yukon
Northern,
Saskatchewan
Northeast, British Columbia
Northwest Territories, Northwest
Territories
North, Manitoba
Nunavut , Nunavut

