

 |
|
 |                |
Information identified as archived is provided for reference, research or recordkeeping purposes. It is not subject to the Government of Canada Web Standards and has not been altered or updated since it was archived. Please "contact us" to request a format other than those available.
| Quarterly Demographic Estimates
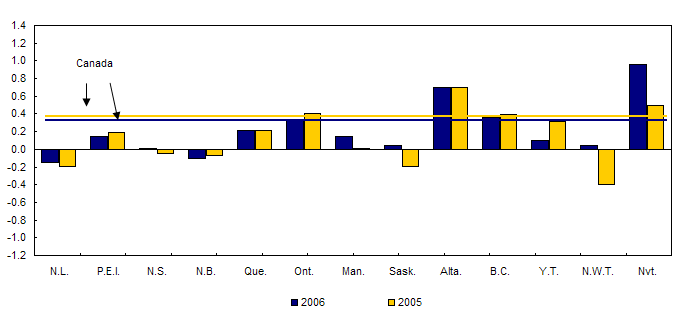
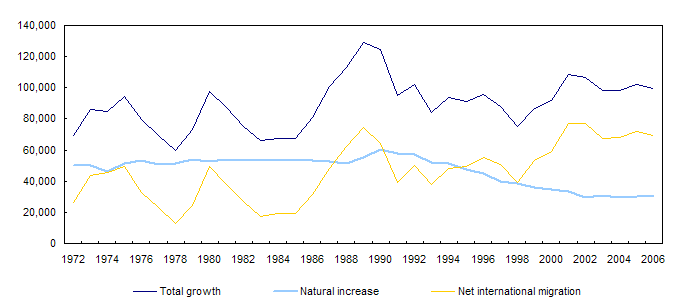
April to June 2006, Preliminary Analysis On July 1, 2006, the population of Canada was estimated at 32,623,500 people, an increase of 99,600 since April 1. Demographic growth of the April and June 2006 period (0,31 %) was virtually identical to the average for second quarters of the last 10 years.  Given the fact that natural growth in Canada has been declining for about fifteen years, although it has remained relatively stable since 2002, international migration continues to be the primary force driving the increase in Canada’s population. Accordingly, 69.4% of Canada’s demographic growth in the last quarter resulted from population shifts with other countries in the world. By comparison, net international migration accounted for an average of 52.1% of total growth in second quarters of the 1990’s and for 41.3% during the 1980’s. Immigration remains high. Although the number of new arrivals in April-June 2006 (67,900) does not equal the historical record set in the same period of 2005 (74,500), it is still slightly higher than the average, for a second quarter, of the 2000-2005 period (66,900). Alberta is the province that continues to show the strongest demographic growth. Through this last quarter, the province’s population grew by 0,70 %, more than twice faster than the Canadian average. In absolute numbers, the province gained more population (23,500) than during any second quarter since 1980 (23,900). Among the territories, Nunavut stands out clearly with a growth rate (0,96 %) higher than Alberta and more than tripling the national growth . Nunavut’s performance is due to its high birth rate and also to the highest net interprovincial migration (+140) in any second quarter since 2002 (350).  British Columbia (0,36 %) and Ontario (0,34 %) are the other regions that showed a population increase above the national average. All other jurisdictions have seen positive demographic growth, though below the national average, with the exception of Newfoundland (-0,15 %) and New Brunswick (-0,10 %). Some jurisdictions posted a far better second quarter in 2006 than in 2005. Due mainly to an improvement of their migratory numbers, Northwest Territories, Saskatchewan and Nova Scotia, which all lost population in the second quarter of 2005, gained population this year. Manitoba and Nunavut also showed better demographic numbers than last year. An international migration attenuating the Alberta draw Net interprovincial migration to Alberta (+11,400) in the second quarter of 2006 was lower than the figure for the same period in the previous year (+12,100). However, only twice in the past has such a high figure been registered in a second quarter. It goes without saying that this kind of magnet affects the demographics of other provinces and territories. British Columbia (+2,300) and Nunavut (+140) and Prince-Edward Island (0) were the only other jurisdictions not to show a negative net interprovincial migration in the second quarter of 2006. Among the regions showing a deficit, New Brunswick posted record losses (-1,100) during the last quarter. For several regions of Canada, net international migration continues to attenuate the effects of the Alberta draw. During the last quarter, international migration was the biggest driver of demographic growth in nine of the country’s 13 jurisdictions. For example, net international migration accounted for 63.3% of population growth in British Columbia. The province was also one of the few Canadian jurisdictions to show an annualized net rate of international migration (+9.0 per thousand) above the national average (+8.5 per thousand), along with Ontario (+11.2 per thousand), Manitoba (+9.7 per thousand) and the Yukon (+9.0 per thousand). In absolute numbers, Manitoba (2,700) and Alberta (5,400) set records for second quarter immigration. New Brunswick (500) and Saskatchewan (700) both received a larger number of immigrants than has been recorded at any time in more than 20 years. Despite a reduction in net international and interprovincial migration compared to the same period in 2005, population growth in Quebec in this past quarter remained stable thanks to the highest increase in natural growth (+7,200) since 1998 (+7,500). This increase is partly due to a greater number of births. According to provisional data, 20,600 babies were born in Quebec during the past quarter, the highest figure for the same period since 1997 (21,600). This is the second consecutive quarter in which a considerable increase in births has been registered in Quebec. The same can be said for Alberta which recorded 10,900 births during the last quarter. The number of births for a second quarter is steadily increasing since 2000 and one has to go back to 1992 (11,100) to observe as many babies. |
|
|
|