
Chart 6
Proportion of population aged 12 to 17 that smoked daily or occasionally, by age group and sex, Canada, 2011/2012 and 2013/2014
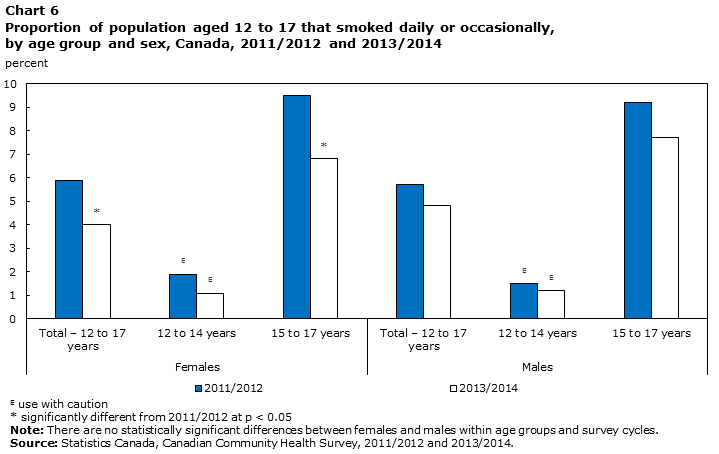
Data table for Chart 6
| Females | Males | |||||
|---|---|---|---|---|---|---|
| Total – 12 to 17 years | 12 to 14 years | 15 to 17 years | Total – 12 to 17 years | 12 to 14 years | 15 to 17 years | |
| percent | ||||||
| 2011/2012 | 5.9 | 1.9Note E: Use with caution | 9.5 | 5.7 | 1.5Note E: Use with caution | 9.2 |
| 2013/2014 | 4Note * | 1.1Note E: Use with caution | 6.8Note * | 4.8 | 1.2Note E: Use with caution | 7.7 |
E use with caution
Source: Statistics Canada, Canadian Community Health Survey, 2011/2012 and 2013/2014. |
||||||
- Date modified: