
Just the Facts
Asylum Claimants
Immigration, Refugees and Citizenship Canada (IRCC) figures are considered preliminary and subject to change. Updated data are published to the IRCC website on a monthly basis as they become available and according to the monthly data release schedule. For the most up-to-date data available, please refer to the IRCC sources below.
Asylum claimants are individuals who request refugee protection upon or after arrival in Canada. Asylum claims can be received at a port of entry, at a Canada Border Services Agency (CBSA) inland office or an Immigration, Refugees and Citizenship Canada (IRCC) inland office. Claims are then referred to the Immigration and Refugee Board of Canada (IRB). While their claims are being considered, these individuals are considered non-permanent residents in Canada.
Asylum claimants whose claims are accepted can become permanent residents. For more information on this process, please refer to the IRCC website: Backgrounder: Claiming asylum in Canada – what happens?
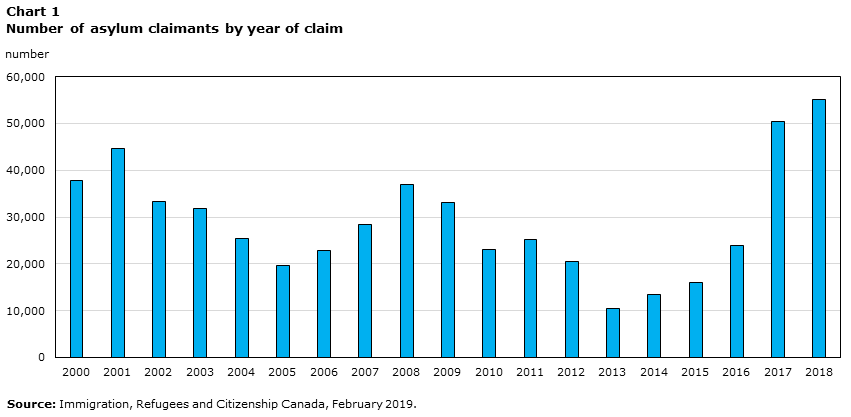
The number of asylum claimants has fluctuated over time
The number of asylum claimants has fluctuated over the years with previous observed peaks in 2008 (about 37,000) and 2001 (about 44,000).The number of asylum claimants more than tripled since 2015, increasing from about 16,000 in 2015 to over 50,000 in 2017.
Data table for Chart 1
| Year | Number |
|---|---|
| 2000 | 37,748 |
| 2001 | 44,640 |
| 2002 | 33,426 |
| 2003 | 31,872 |
| 2004 | 25,526 |
| 2005 | 19,748 |
| 2006 | 22,920 |
| 2007 | 28,496 |
| 2008 | 36,856 |
| 2009 | 33,153 |
| 2010 | 23,130 |
| 2011 | 25,315 |
| 2012 | 20,472 |
| 2013 | 10,365 |
| 2014 | 13,442 |
| 2015 | 16,058 |
| 2016 | 23,870 |
| 2017 | 50,389 |
| 2018 | 55,023 |
| Source: Immigration, Refugees and Citizenship Canada, February 2019. | |
The data included in this chart are considered preliminary and subject to change. For the most up-to-date information available, please refer to Asylum claims.
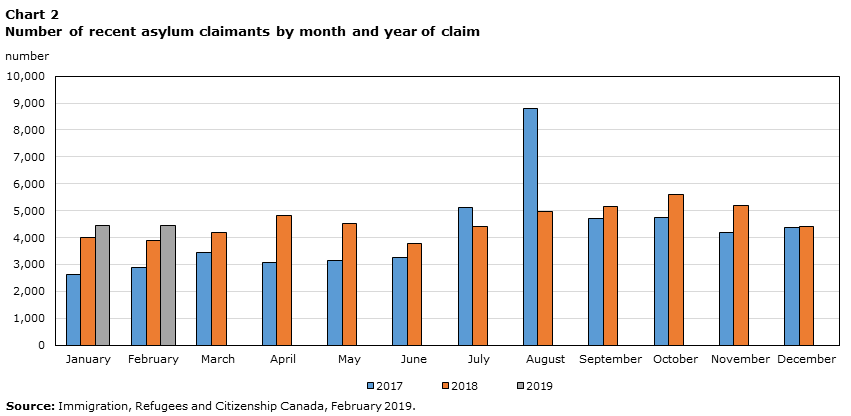
The number of asylum claimants has been increasing in recent years reaching a peak in August 2017
The number of claimants has increased since the beginning of 2017, from 2,629 in January 2017 to 5,118 in December 2018.
Data table for Chart 2
| 2017 | 2018 | 2019 | |
|---|---|---|---|
| number | |||
| January | 2,629 | 4,003 | 4,434 |
| February | 2,903 | 3,908 | 4,447 |
| March | 3,431 | 4,202 | Note ..: not available for a specific reference period |
| April | 3,071 | 4,814 | Note ..: not available for a specific reference period |
| May | 3,132 | 4,526 | Note ..: not available for a specific reference period |
| June | 3,273 | 3,773 | Note ..: not available for a specific reference period |
| July | 5,114 | 4,402 | Note ..: not available for a specific reference period |
| August | 8,801 | 4,975 | Note ..: not available for a specific reference period |
| September | 4,719 | 5,171 | Note ..: not available for a specific reference period |
| October | 4,754 | 5,611 | Note ..: not available for a specific reference period |
| November | 4,186 | 5,210 | Note ..: not available for a specific reference period |
| December | 4,376 | 4,428 | Note ..: not available for a specific reference period |
|
.. not available for a specific reference period Source: Immigration, Refugees and Citizenship Canada, February 2019. |
|||
The data included in this chart are considered preliminary and subject to change. For the most up-to-date information available, please refer to Asylum claims.
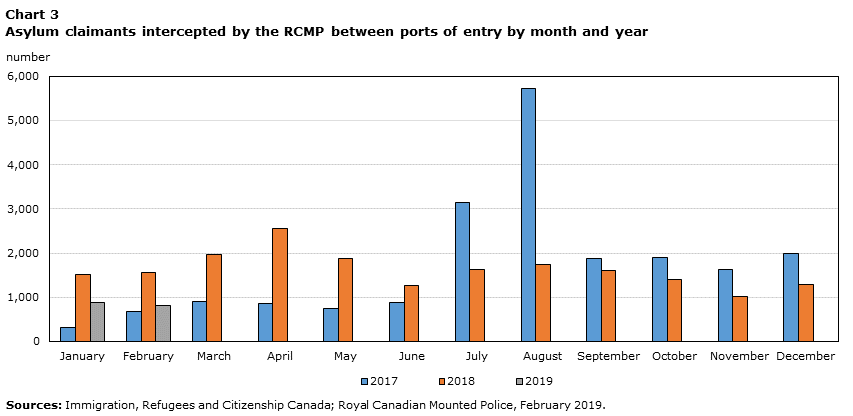
The recent increase in the number of asylum claimants is partly explained by the rise in irregular migrants
The increase in the number of asylum claimants over the past 2 years is partly explained by an increase in irregular migrants (individuals entering Canada between ports of entry) claiming asylum in Canada. However, asylum claims being submitted by those entering Canada regularly are also increasing.
Asylum claimants seeking entrance into Canada between ports of entry are intercepted by the RCMP. In most cases, apprehended individuals are turned over to CBSA or IRCC for an asylum claim to be processed.
Data table for Chart 3
| 2017 | 2018 | 2019 | |
|---|---|---|---|
| number | |||
| January | 315 | 1,517 | 888 |
| February | 678 | 1,565 | 808 |
| March | 897 | 1,970 | Note ..: not available for a specific reference period |
| April | 859 | 2,560 | Note ..: not available for a specific reference period |
| May | 742 | 1,869 | Note ..: not available for a specific reference period |
| June | 884 | 1,263 | Note ..: not available for a specific reference period |
| July | 3,134 | 1,634 | Note ..: not available for a specific reference period |
| August | 5,712 | 1,747 | Note ..: not available for a specific reference period |
| September | 1,881 | 1,601 | Note ..: not available for a specific reference period |
| October | 1,890 | 1,394 | Note ..: not available for a specific reference period |
| November | 1,623 | 1,019 | Note ..: not available for a specific reference period |
| December | 1,978 | 1,280 | Note ..: not available for a specific reference period |
|
.. not available for a specific reference period Sources: Immigration, Refugees and Citizenship Canada; Royal Canadian Mounted Police, February 2019. |
|||
The data included in this chart are considered preliminary and subject to change. For the most up-to-date information available, please refer to Asylum claims.
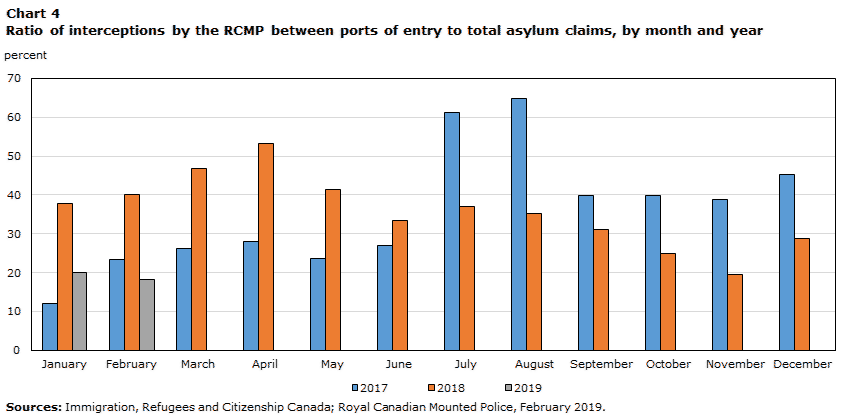
Over the last two years, asylum claimants intercepted between ports of entry by the RCMP represented about 40% of the total number of asylum claimants.
Data table for Chart 4
| 2017 | 2018 | 2019 | |
|---|---|---|---|
| percent | |||
| January | 12.0 | 37.9 | 20.0 |
| February | 23.4 | 40.0 | 18.2 |
| March | 26.1 | 46.9 | Note ..: not available for a specific reference period |
| April | 28.0 | 53.2 | Note ..: not available for a specific reference period |
| May | 23.7 | 41.3 | Note ..: not available for a specific reference period |
| June | 27.0 | 33.5 | Note ..: not available for a specific reference period |
| July | 61.3 | 37.1 | Note ..: not available for a specific reference period |
| August | 64.9 | 35.1 | Note ..: not available for a specific reference period |
| September | 39.9 | 31.0 | Note ..: not available for a specific reference period |
| October | 39.8 | 24.8 | Note ..: not available for a specific reference period |
| November | 38.8 | 19.6 | Note ..: not available for a specific reference period |
| December | 45.2 | 28.9 | Note ..: not available for a specific reference period |
|
.. not available for a specific reference period Sources: Immigration, Refugees and Citizenship Canada; Royal Canadian Mounted Police, February 2019. |
|||
The data included in this chart are considered preliminary and subject to change. For the most up-to-date information available, please refer to Asylum claims.
Who are the recent asylum claimants and where do they come from?
The countries of citizenship for asylum claimants vary over time, and typically reflect global migration trends. While Haiti, Nigeria, and the United States of America were the top three source countries for asylum claimants in 2017, Mexico, Haiti and Colombia were the principal countries of citizenship for asylum claimants in 2007.
A disproportionately high number of asylum claimants in 2017 were children aged 0 to 14. Over 26% of 2017 asylum claimants were aged 0-14. This compares with about 16% of the population living in Canada on July 1st, 2017 in the same age group (Statistics Canada. Table 17-10-0005-01 Population estimates on July 1st, by age and sex).
The majority of asylum claimants in 2017 were male.
| Number | |
|---|---|
| 2007 Asylum claimants: top 5 countries of citizenship | |
| Mexico | 7,153 |
| Haiti | 3,240 |
| Colombia | 2,572 |
| United States of America | 1,807 |
| People's Republic of China | 1,341 |
| Other countries of origin | 12,383 |
| Total | 28,496 |
| 2017 Asylum claimants: top 5 countries of citizenship | |
| Haiti | 7,787 |
| Nigeria | 6,007 |
| United States of America | 2,541 |
| Turkey | 2,200 |
| Pakistan | 1,751 |
| Other countries of origin | 30,103 |
| Total | 50,389 |
| Source: Immigration, Refugees and Citizenship Canada, February 2019. | |
The data included in this table are considered preliminary and subject to change. For the most up-to-date information available, please refer to Asylum claims.
| Age group | Male | Female | Total | ||
|---|---|---|---|---|---|
| number | percent | number | percent | ||
| 0-14 | 6,810 | 51.6 | 6,383 | 48.4 | 13,193 |
| 15-24 | 3,709 | 58.2 | 2,663 | 41.8 | 6,375 |
| 25-34 | 7,010 | 55.2 | 5,674 | 44.7 | 12,688 |
| 35-44 | 6,516 | 58.2 | 4,683 | 41.8 | 11,205 |
| 45-54 | 2,619 | 58.8 | 1,832 | 41.1 | 4,453 |
| 55+ | 1,162 | 46.9 | 1,313 | 53.1 | 2,475 |
| Total | 27,826 | 55.2 | 22,548 | 44.7 | 50,389 |
|
Note: Male and Female figures may not add up to the totals due to some cases where gender is not specified. Source: Immigration, Refugees and Citizenship Canada, February 2019. |
|||||
The data included in this table are considered preliminary and subject to change. For the most up-to-date information available, please refer to Asylum claims.
Not all asylum claimants become permanent residents of Canada
Each claim submitted by an asylum claimant is assessed and can be approved or denied. Those whose claims are successful, can apply to become permanent residents as Protected Persons in Canada. While the majority of claimants become permanent residents as Protected Persons in Canada, they can also become permanent residents through other admission categories even if their claim is ultimately denied.
| Year claim was made | Total claimants | Final outcome still pending | Failed claimantsTable 3 Note 1 | Successful claimantsTable 3 Note 2 | Claimants who become permanent residents of Canada |
|---|---|---|---|---|---|
| number | |||||
| 2007 | 28,496 | 282 | 17,054 | 11,160 | 16,684 |
| 2008 | 36,856 | 466 | 22,650 | 13,740 | 20,577 |
| 2009 | 33,153 | 635 | 22,422 | 10,096 | 15,119 |
| 2010 | 23,130 | 758 | 13,946 | 8,426 | 11,630 |
| 2011 | 25,315 | 1,566 | 14,981 | 8,768 | 11,488 |
| 2012 | 20,472 | 5,758 | 9,604 | 5,110 | 7,615 |
| 2013 | 10,365 | 282 | 4,612 | 5,471 | 6,152 |
| 2014 | 13,442 | 994 | 4,500 | 7,948 | 8,066 |
| 2015 | 16,058 | 1,111 | 5,246 | 9,701 | 8,431 |
| 2016 | 23,870 | 1,781 | 7,730 | 14,359 | 8,541 |
| 2017 | 50,389 | 27,225 | 10,930 | 12,234 | 1,987 |
|
|||||
The data included in this table are considered preliminary and subject to change. For the most up-to-date information available, please refer to Asylum claims.
The most common means of becoming permanent residents for asylum claimants are presented below.
| Year claim was made | Total claimants who become permanent residents of Canada | Protected Persons in Canada | Immigrants sponsored by family | Humanitarian and Compassionate cases | Economic immigrants | All other admissions categories for asylum claimants |
|---|---|---|---|---|---|---|
| number | ||||||
| 2007 | 16,684 | 12,091 | 2,147 | 2,218 | 115 | 113 |
| 2008 | 20,577 | 14,874 | 2,574 | 2,695 | 148 | 286 |
| 2009 | 15,119 | 10,310 | 2,335 | 2,003 | 122 | 349 |
| 2010 | 11,630 | 8,121 | 1,715 | 1,332 | 85 | 377 |
| 2011 | 11,488 | 8,019 | 1,699 | 1,277 | 56 | 437 |
| 2012 | 7,615 | 5,083 | 1,381 | 804 | 44 | 303 |
| 2013 | 6,152 | 5,154 | 316 | 514 | 9 | 159 |
| 2014 | 8,066 | 7,301 | 252 | 348 | 6 | 159 |
| 2015 | 8,431 | 7,791 | 223 | 216 | 12 | 189 |
| 2016 | 8,541 | 8,131 | 159 | 70 | 7 | 174 |
| 2017 | 1,987 | 1,864 | 57 | 4 | 5 | 56 |
| Source: Immigration, Refugees and Citizenship Canada, February 2019. | ||||||
The data included in this table are considered preliminary and subject to change. For the most up-to-date information available, please refer to Asylum claims.
Most Protected Persons in Canada reside in Ontario
An asylum claimant whose claim is approved can apply to become permanent residents as Protected Persons in Canada. Over two thirds of Protected Persons in Canada admitted in 2016 resided in Ontario on December 31st in the same year. By comparison, among all immigrants admitted in 2016, less than 40% resided in Ontario at the end of the same year.
| 2011 | 2012 | 2013 | 2014 | 2015 | 2016 | |
|---|---|---|---|---|---|---|
| number | ||||||
| Protected person in Canada by province of residence | ||||||
| Total | 8,530 | 6,725 | 6,430 | 6,120 | 6,555 | 6,300 |
| percent | ||||||
| Atlantic provinces | 0.2 | 0.3 | 0.5 | 0.2 | 0.5 | 0.4 |
| Quebec | 20.2 | 21.6 | 20.2 | 24.2 | 24.2 | 19.0 |
| Ontario | 68.3 | 64.8 | 64.9 | 58.6 | 60.1 | 66.8 |
| Manitoba | 0.4 | 0.4 | 0.6 | 0.3 | 0.5 | 0.5 |
| Saskatchewan | 0.4 | 0.4 | 0.5 | 0.2 | 0.7 | 0.4 |
| Alberta | 5.7 | 8.3 | 8.9 | 11.2 | 9.2 | 7.7 |
| British Columbia | 4.6 | 4.0 | 4.2 | 5.1 | 4.9 | 5.2 |
| Territories | 0.0 | 0.0 | 0.2 | 0.2 | 0.0 | 0.0 |
| number | ||||||
| Immigrants in Canada by province of residence | ||||||
| Total | 152,585 | 162,900 | 168,735 | 174,385 | 180,375 | 186,485 |
| percent | ||||||
| Atlantic provinces | 2.2 | 2.1 | 2.2 | 2.4 | 2.2 | 3.4 |
| Quebec | 19.6 | 19.6 | 18.5 | 16.6 | 15.9 | 16.3 |
| Ontario | 39.7 | 38.5 | 39.5 | 37.6 | 38.8 | 39.3 |
| Manitoba | 6.1 | 4.8 | 4.7 | 5.5 | 4.9 | 4.8 |
| Saskatchewan | 3.7 | 4.3 | 4.2 | 4.4 | 4.4 | 4.3 |
| Alberta | 13.5 | 15.7 | 15.7 | 18.6 | 18.9 | 17.3 |
| British Columbia | 14.9 | 14.8 | 15.0 | 14.6 | 14.7 | 14.4 |
| Territories | 0.2 | 0.2 | 0.2 | 0.2 | 0.2 | 0.2 |
|
Notes: The Longitudinal Immigration Database (IMDB) is an administrative database that combines data from Immigration, Refugees and Citizenship Canada (IRCC) with the T1 Family Files (T1FF) through record linkage. Of the immigrants who landed in any year from 1980 to 2016 and filed tax since 1982, 83.0% were linked to at least one T1FF record. Admission year is the year in which the immigrant first obtained his or her landed immigrant/permanent resident status. This may or may not be the same as the year of arrival. The figures are based on immigrants who filed taxes in the year of their admission to Canada. Source: Statistics Canada, 2016 Longitudinal Immigration Database, table 43-10-0010-01, Immigrant Income by admission year and immigrant admission category, Canada and provinces. |
||||||
Income of Protected Persons in Canada
The average wages of Protected Persons in Canada admitted in 2006 increased from $22,100, in their first year as permanent residents, to $32,500, 10 years after admission. While 39% of Protected Persons in Canada claimed some social assistance in the year following admission, this declined to 20% 10 years after admission.
| Immigrants admitted in 2006 | Total | Mean total income | Percentage with salaries and wages | Mean salaries and wages | Percentage with self-employment income | Mean self-employment income | Percentage with social assistance |
|---|---|---|---|---|---|---|---|
| number | dollars | percent | dollars | percent | dollars | percent | |
| Protected Persons in Canada | |||||||
| 1 year since admission | 12,400 | 22,100 | 64 | 21,800 | 14 | 10,900 | 39 |
| 3 years since admission | 12,680 | 24,900 | 64 | 24,900 | 17 | 10,800 | 29 |
| 5 years since admission | 12,800 | 27,100 | 64 | 28,000 | 18 | 10,200 | 26 |
| 10 years since admission | 13,170 | 32,500 | 64 | 33,300 | 17 | 11,900 | 20 |
| All immigrants | |||||||
| 1 year since admission | 166,660 | 25,700 | 67 | 25,900 | 10 | 13,300 | 11 |
| 3 years since admission | 173,945 | 29,900 | 66 | 30,500 | 12 | 12,600 | 10 |
| 5 years since admission | 175,675 | 33,000 | 67 | 34,000 | 14 | 12,100 | 9 |
| 10 years since admission | 179,420 | 40,300 | 67 | 40,700 | 14 | 13,600 | 7 |
|
Notes: The Longitudinal Immigration Database (IMDB) is an administrative database that combines data from Immigration, Refugees and Citizenship Canada (IRCC) with the T1 Family Files (T1FF) through record linkage. Of the immigrants who landed in any year from 1980 to 2016 and filed tax since 1982, 83.0% were linked to at least one T1FF record. Admission year is the year in which the immigrant first obtained his or her landed immigrant/permanent resident status. This may or may not be the same as the year of arrival. The figures are based on immigrants who filed taxes 1 year, 3 years, 5 years and 10 years after admission to Canada. Wages, salaries and commissions is the sum of T4 earnings (line 101 on the income tax form) and other employment income (line 104). Self-employment income is the sum of self-employment income (from business (line 135), professional (line 137), commission (line 139), farming (line 141) or fishing (line 143) income) and limited partnership (line 122) income. Social welfare benefits are family level financial assistance/benefits provided by federal and/or provincial programs. All income is the sum of wages, salaries and commissions, self-employment income, investment income, and employment insurance benefits. Source: Statistics Canada, 2016 Longitudinal Immigration Database, table 43-10-0010-01, Immigrant Income by admission year and immigrant admission category, Canada and provinces. |
|||||||
- Date modified: