Iron sufficiency of Canadians, 2009 to 2011

Archived Content
Information identified as archived is provided for reference, research or recordkeeping purposes. It is not subject to the Government of Canada Web Standards and has not been altered or updated since it was archived. Please "contact us" to request a format other than those available.
![]()
The overall percentage of Canadians with sufficient serum ferritin concentrations was 96%, indicating that the majority of the population has sufficient iron stores. However, 8% of all females had low serum ferritin concentrations, suggesting iron deficiency.
Iron deficiency is one of the largest nutritional public health problems in both developing and industrialized countries.1 Toddlers and females of childbearing age are at the highest risk of having low levels of iron.1 Perhaps the most common health effect of iron deficiency is a large drop in energy and capability to do physical work. However, deficiencies in iron can also cause maternal and infant death, lower children's mental and physical development and lower cognitive function in adults.1
The primary source of iron is through the diet. Foods with higher sources of iron include red meat products, foods fortified with iron, such as cereals, pasta and breads, and certain fruits and vegetables. Although lack of adequate intake of iron rich foods can lead to iron deficiency, loss of blood, for example due to menstruation, can also greatly reduce iron levels.
Hemoglobin
According to data collected by the Canadian Health Measures Survey (2009 to 2011), 97% of Canadians aged 3 to 79 years had hemoglobin concentrations above reference values for age and sex, indicating they were not anemic. Females were more likely to have hemoglobin concentrations below reference values than males. In comparison to the Nutrition Canada Survey (1970 to 1972), the percentage of individuals with hemoglobin concentrations above reference values is generally higher now than it was forty years ago (Table 1). However, the percentage of Canadians aged 65 to 79 with adequate hemoglobin concentrations has decreased since the early 1970s, particularly in females who declined from 96% to 90%.2
| Sex / Age group (years) | Hemoglobin sufficiency (%) | |
|---|---|---|
| Nutrition Canada | CHMS | |
| Both sexes | ||
| 3 to 5 | 99 | 99 |
| Males | ||
| 6 to 11 | 95 | 97 |
| 12 to 19 | 99 | 100 |
| 20 to 49 | 99 | 99 |
| 50 to 64 | 97 | 99 |
| 65 to 79 | 94 | 93 |
| Females | ||
| 6 to 11 | 95 | 97 |
| 12 to 19 | 96 | 97 |
| 20 to 49 | 94 | 96 |
| 50 to 64 | 94 | 97 |
| 65 to 79 | 96 | 90 |
| Sources: Nutrition Canada Survey, 1970 to 19722; Canadian Health Measures Survey, 2009 to 2011. The CHMS collects health information on the Canadian household population aged 3 to 79. | ||
Serum Ferritin
Most Canadians (96%) had sufficient serum ferritin concentrations, indicating that the majority of the Canadian population has sufficient iron stores. However, the percentage of individuals with sufficient serum ferritin concentrations varied by age-sex groups (Chart 1), where males (99%) were more likely to have sufficient iron stores compared to females (92%). Females aged 12 to 19 had the lowest percentage of individuals with sufficient serum ferritin concentrations (87%), suggesting they were most at risk of being iron deficient.
Chart 1
Ferritin sufficiency, by age group and sex, household population aged 3 to 79, Canada, 2009 to 2011
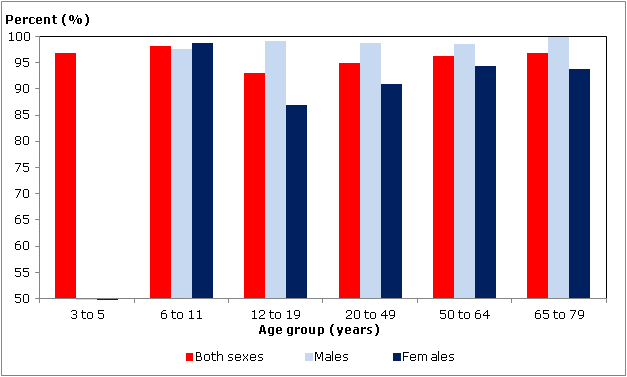
Note: The sample size for 3 to 5 year olds produces reliable national estimates for both sexes combined only.
Source: Canadian Health Measures Survey, 2009 to 2011. The CHMS collects health information on the Canadian household population aged 3 to 79.
About iron status
Two of the best indicators for assessing iron status are hemoglobin concentration and serum ferritin concentration.1 Hemoglobin is a protein in red blood cells that contains large amounts of iron and its concentration (often expressed in grams per liter (g/L)) is a measure of anemia.1 Anemia is defined as an insufficient mass of red blood cells circulating in the blood.1 However, hemoglobin concentration does not always represent iron deficient anemia as other factors, such as low folic acid and vitamin B12 concentration can cause anemia.1 Serum ferritin concentration (often expressed in micrograms per liter (µg/L)) is a measure of the amount of stored iron and provides information on the amount of iron that is not currently being used by tissues but is available for use when dietary iron becomes temporarily insufficient.1
Iron deficiency is defined using reference values for hemoglobin and serum ferritin concentration that vary by age-sex groups and pregnancy status (Table 2), where concentrations below the reference values indicate iron deficiency.
| Age Group and Sex | Hemoglobin | Serum Ferritin |
|---|---|---|
| 3 to 5 years | ≥110 g/L | ≥12 ug/L |
| 6 to 11 years | ≥115 g/L | ≥15 ug/L |
| 12 to 19 years | ≥120 g/L | ≥15 ug/L |
| 20 to 49 years | ≥15 ug/L | |
| Non-pregnant women | ≥120 g/L | |
| Pregnant women | ≥110 g/L | |
| Men | ≥130 g/L | |
| 50 to 79 years | ≥15 ug/L | |
| Non-pregnant women | ≥120 g/L | |
| Men | ≥130 g/L |
More information on this topic is available in "Iron sufficiency of Canadians" Health Reports, Vol. 23, No. 4 (82-003-XPE, free).
References
- World Health Organization, UNICEF, UNU. Iron Deficiency Anaemia: Assessment, Prevention, and Control. A guide for programme managers. Available at: http://www.whqlibdoc.who.int/hq/2001/WHO_NHD_01.3.pdf (accessed June 25, 2012).
- Health and Welfare Canada. Nutrition Canada National Survey. Ottawa: Health and Welfare Canada; 1973.
For more information on the Canadian Health Measures Survey, please contact Statistics Canada's National Contact Centre (toll-free 1-800-263-1136; 613-951-8116; infostats@statcan.gc.ca).
- Date modified: