
Figure 3
Census tracts that underwent gentrification between 2006 and 2016, Vancouver census metropolitan area
Description for Figure 3
Figure 3
Census tracts that underwent gentrification between 2006 and 2016, Vancouver census metropolitan area
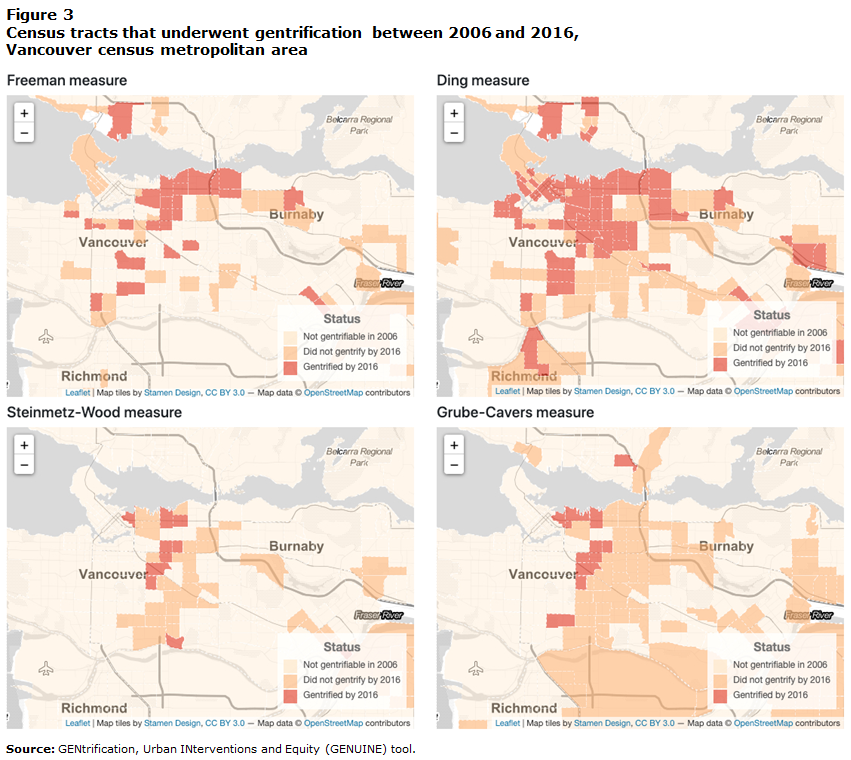
The figure shows four maps of Vancouver, one for each of the following measures: Freeman, Ding, Steinmetz-Wood and Grube-Cavers. Each figure presents areas that were gentrified in 2016, not gentrifiable in 2006 or not gentrified by 2016. The Ding measure identified the most areas gentrified by 2016, followed by Freeman and Grube-Cavers. Grube-Cavers identified more areas that did not gentrify by 2016. Steinmetz-Wood identified more areas that were not gentrifiable in 2006.
Source: GENtrification, Urban Interventions, and Equity (GENUINE) tool.
- Date modified: