
Figure 4
Distribution of usual energy contributed by UPF, by age and sex, household population aged 2 to 18, Canada excluding territories, 2004 and 2015‡
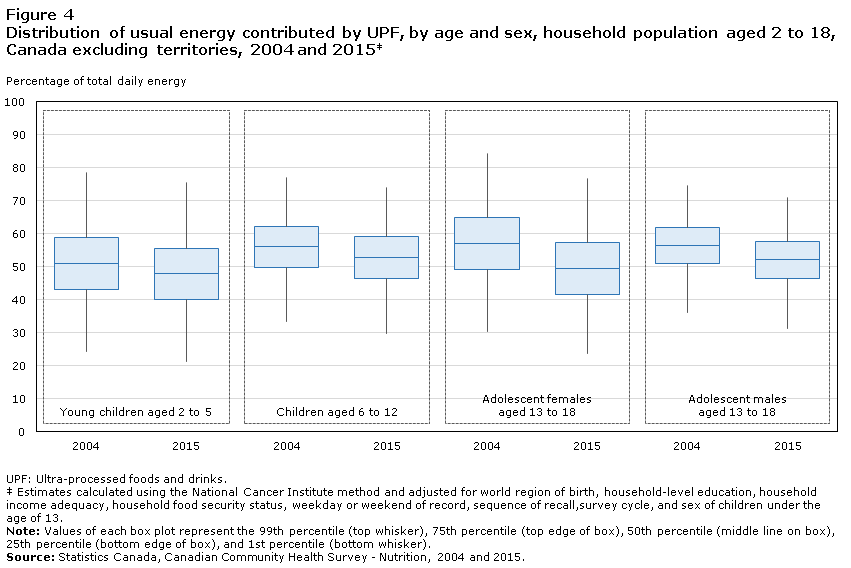
Data table for Figure 4
| Percentile | Young children aged 2 to 5 | Children aged 6 to 12 | Adolescent females aged 13 to 18 | Adolescent males aged 13 to 18 | ||||
|---|---|---|---|---|---|---|---|---|
| 2004 | 2015 | 2004 | 2015 | 2004 | 2015 | 2004 | 2015 | |
| 1st | 24.5 | 21.2 | 33.5 | 29.8 | 30.3 | 23.8 | 36.0 | 31.4 |
| 25th | 43.2 | 40.1 | 49.8 | 46.4 | 49.2 | 41.7 | 51.0 | 46.3 |
| Median | 50.9 | 47.8 | 56.0 | 52.8 | 57.0 | 49.6 | 56.5 | 52.1 |
| 75th | 58.8 | 55.6 | 62.2 | 59.1 | 64.9 | 57.5 | 61.9 | 57.7 |
| 99th | 78.5 | 75.5 | 77.0 | 74.1 | 84.3 | 76.8 | 74.8 | 70.9 |
Note: Values of each box plot represent the 99th percentile (top whisker), 75th percentile (top edge of box), 50th percentile (middle line on box), 25th percentile (bottom edge of box), and 1st percentile (bottom whisker). Source: Statistics Canada, Canadian Community Health Survey - Nutrition, 2004 and 2015. |
||||||||
- Date modified: