Trends in the Age Composition of College and University Students and Graduates

Archived Content
Information identified as archived is provided for reference, research or recordkeeping purposes. It is not subject to the Government of Canada Web Standards and has not been altered or updated since it was archived. Please "contact us" to request a format other than those available.
Meghan Dale
Statistics Canada
Changes in the age composition of college and university students over time
Does the age composition of college and university students vary by other demographic characteristics?
What can age tell us about the program choices people make when pursuing postsecondary education?
Conclusion
While many students in Canada attend postsecondary institutions directly out of high school, they do not represent all college and university students. Some delay going on to college or university, while others may return for skills upgrading later in life or to pursue further postsecondary education.
The age composition of college and university students in Canada is affected by a number of factors. Increasing entrance requirements to professional careers mean that more students pursue postsecondary education than ever before. Age may increase as people return to school to improve their career prospects. On the other hand, age may decrease as more young people go directly into postsecondary education before entering the work force. Those who do choose to participate in postsecondary education can choose either college or university studies. By examining the age of students in these two institution types separately, differences in student makeup can be observed.
Age trends can be examined using either average or median age. Average age is expected to be skewed – while the vast majority of students will be in their late teens and early 20s, older adults also represent a significant portion of the student population. Measures based on median age – that is, the age at which half the students are older and half are younger – therefore provide more reliable indicators of trends in the age composition of students and recent graduates of colleges and universities. This article reports on trends over time in median age and changes in the age distributions of college and university students and graduates.
This analysis addresses four key questions. Has the age composition of postsecondary students changed over time? Does the age composition of students in postsecondary institutions vary by other demographic characteristics? Does the age composition vary by program level? Finally, what do changes in age trends tell us about patterns of participation in college and university?
The data for this study are provided by the Postsecondary Student Information System (PSIS). Data on age are currently available for the 1992 to 2007 period for universities and for the 2000 to 2006 period for colleges (Box 1).
Box 1:
The Postsecondary Student Information System
The Postsecondary Student Information System (PSIS) is an administrative database that collects detailed information from Canadian colleges and universities on students and graduates, including, for example, information on age, gender, citizenship and program of study. The age data for some colleges reported before 2000 were collected at an aggregate level and are not comparable to the data available since 2000 from PSIS. For this reason, analysis of trends in the age of college students and graduates is restricted to 2000 onward.
End of box
Changes in the age composition of college and university students over time
In 2006, over 1.6 million students were enrolled in colleges and universities in Canada and roughly 400,000 of them graduated in that year. Students ranged in age from 10 to 98 years old, but most did not fall on these extremes. Over 75% of students were between 17 and 27 years of age and over 90% of them were under age 40.
According to the most recently available data, the median age of college students in 2006 was 21.6 years, while for university students, the median age was 22.8 years in 2007. The median age at graduation of college students in 2006 was about two years less than that of university graduates in 2007, at 22.7 years old and 24.8 years old, respectively.
The median age of university students decreased from 23.8 years in 1992 to 22.8 years in 2007, while the median age at graduation was 24.8 years in both 1992 and 2007. As a result, the gap in the median age of university students and that of graduates increased by one year. Several factors may account for this finding. For example, university students may be taking more time to complete their studies, program length may be increasing or students may be pursuing post-graduate studies in greater numbers.
Another way of looking at age trends is to examine the age distribution of students and graduates. In 1992, 57% of university students were between the ages of 17 and 24; by 2007, 17 to 24 year-olds accounted for 65% of university students (Chart 1).1 Similarly, in colleges, 69% of students were aged 17 to 24 in 2006 (Chart 2).
Chart 1
Age distribution of university students, 1992 and 2007
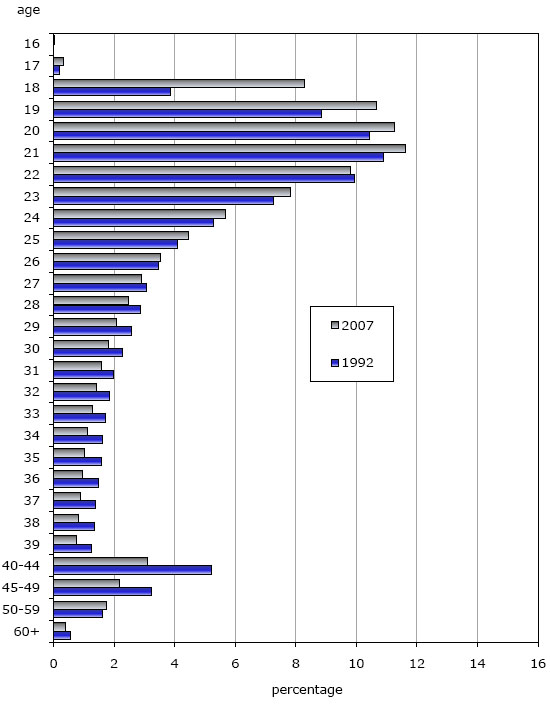
Source: Statistics Canada, Postsecondary Student Information System.
Chart 2
Age distribution of college students, 2006
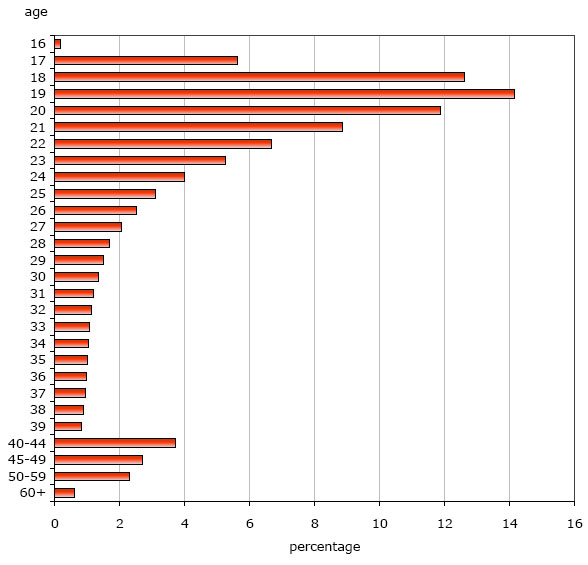
Note: Comparable data on the age distribution of college students is not available for 1992.
Source: Statistics Canada, Postsecondary Student Information System.
Does the age composition of college and university students vary by other demographic characteristics?
SexThere are little differences between males and females in terms of median age of students and graduates. In 2006, the median ages of male and female college students were 21.4 and 21.7 years, respectively. At universities in 2007, the median ages of male and female students were 22.9 and 22.7 years, respectively.
However, the distribution of ages shows a higher peak for men than for women in all years, indicating that there was a narrower range in men's ages, though a trend toward more compression in the age distribution is also apparent in the case of female university students. Similarly, the age distribution of college women (both students and graduates) shows a wider range than that of their male counterparts. For example, in 2006, 21.6% of female college students were over age 30, compared to 16.0% of males.
International studentsInternational students made up about 5% of the college population in 2006 and 9% of the university population in 2007. As a result of their smaller numbers, the effect they have on median age is masked by trends in the overall student population. When international students are examined separately, different age patterns than those observed for the student body as a whole are observed.2
Compared to the overall student population, international university students show a higher median age than Canadian students; however, they also show a larger decrease in median age over time. While the median age of Canadian university students decreased from 23.7 years in 1992 to 22.8 years in 2007, the median age of international university students decreased from 25.3 years to 23.2 years over the same period. In addition, the age distribution of international university students was narrower than for their Canadian counterparts in 2007, with the former having a higher proportion of students between the ages of 19 and 24 years. In 2007, fewer than 10% of international university students were over age 35 compared to 17% of Canadian students.
What can age tell us about the program choices people make when pursuing postsecondary education?
When choosing to pursue a college or university education, students must decide on which type of program is best suited for them. For example, those who attend college or university directly after high school may choose different programs than those who are returning to school after a period of time out of the education system. They must choose college or university, undergraduate or graduate programs, and field of study.3
In 2006, the majority of college students were enrolled in one of two program types: a college postsecondary program (73%) or a university transfer program (23%), with the remaining 4% being in a variety of other courses.
The most common form of university transfer program is found in Quebec where students complete two years of pre-university studies at a CEGEP, earning a Pre-university Diploma of College Studies (DCS), which is a prerequisite for entering university. In other provinces, university transfer programs are programs wherein students can complete the first year or two of bachelor degree programs at a college prior to transferring to a university to complete the degree. Overall, college students in Quebec accounted for about 70% of students in university transfer programs in Canada in 2006.
Students in university transfer programs have been consistently 3 to 5 years younger than those in other college programs. The distribution of ages in 2006 shows that 90% of those in a university transfer program were between the ages of 17 and 23, compared to 65% of students enrolled in other college programs.
Differences in the median age of university students at different program levels reflect the cumulative nature of university studies. The "first professional degree" category, which includes degrees in law, divinity, or veterinary medicine, typically requires completion of a few years of undergraduate studies for entry. Similarly, the prerequisite for most master's programs is a previous 3- or 4- year bachelor's degree, while the majority of Canadian PhD programs require a master's degree for entry. It is therefore not surprising that the median age of students pursuing a bachelor's degree is lower than that of those pursuing a first professional degree or a master's degree, who, in turn, tend to be younger than those in a PhD program.
While the nominal length of most bachelor's degree programs is 3 to 4 years, the gap in median age between bachelor's and master's students is approximately 7 years. This suggests that many students do not enter graduate studies immediately following graduation from a bachelor's program, but are adults who later return to pursue graduate degrees. It also suggests that bachelor's and master's students may be taking longer to complete their programs of study. This is evident when examining the age distribution of students at each level, with each showing a wider age range than the level before it. Each level - bachelor's, master's, and PhD - shows the characteristic decrease in average age over time, but the effect is less pronounced with each successive level of study (Chart 3). The median ages for both bachelor's and master's have decreased one year since 1992, while the median age of PhD students has fluctuated over time.
Chart 3
Age distribution of university students, by program level, 2007

Source: Statistics Canada, Postsecondary Student Information System.
There are two final categories that make up the university student body: those taking undergraduate- and graduate-level certificate and diploma programs. These are short (1- to 2-year) programs that often provide specialization in a subject that has a corresponding broader degree program. Undergraduate-level certificate and diploma programs can be taken before, during or after a bachelor's degree, while a bachelor's degree is required for entry into graduate-level certificate and diploma programs.
The age composition of students in these two types of program is very different from the rest of the student body. The median age of students in the graduate-level certificate and diploma programs was 33.6 years in 2007, the highest of students at all program levels. However, it is notable that, at 30.3 years, the median age of students in undergraduate certificate and diploma programs was also significantly higher than the median for the overall university student population. Both types of program had roughly equal amounts of students at each age spanning 12 years: age 21 to 33 for those in the undergraduate certificate and diploma programs and age 23 to 36 for those in the graduate-level programs.
Conclusion
In the past, the common practice was to refer to 17 to 21 year-olds as the 'typical' college student and to 19 to 24 year-olds as the 'typical' university student. The analysis reported here clearly demonstrates that today, there is no longer a marked distinction between colleges and universities in terms of age of students. In 1992, 57% of university students were between the ages of 17 and 24; that share has increased such that by 2007, 17 to 24 year-olds accounted for 65% of university students. Similarly, in colleges, 69% of students were aged 17 to 24 in 2006.
No real differences were observed between male and female college and university students in terms of median age. That being said, the age distribution of college women (both students and graduates) showed a wider range than that of their male counterparts - in 2006, 21.6% of female college students were over age 30, compared to 16.0% of males.
These trends also reflect changes in the nature of programs offered at both colleges and universities over time. An important change in many provinces in the 1990s was the introduction of university transfer programs at colleges, though such programs have been common in Quebec since the 1960s. Job re-training programs also play an important role in providing opportunities for older workers to up-date their skills in a labour market characterized by technological change and shifts in global production patterns. Universities have experienced changes as well, with increasing numbers of international students and expanded program offerings that include certificate and diploma programs at the undergraduate level.
In sum, more students are attending college and university than ever before, and those who choose to attend do not necessarily follow a "typical" pattern: some are starting earlier, some are returning to school, and others are staying longer in order to complete their programs of study or to pursue graduate studies.
Notes
-
Part of this change reflects the fact that Ontario eliminated the final year of high school in the early 2000s. As a result, the typical high school graduate is now one year younger than they were before this change.
-
The overall numbers of international students and graduates at colleges are very small, resulting in wide variation in median age from year to year. As a result, they are excluded from the discussion of median age over time.
-
Prospective students may also decide to enroll in trade and apprenticeship programs. These programs were not included in the analysis.
- Date modified: