
Statistics Canada
www.statcan.gc.ca
Common menu bar links

Archived Content
Information identified as archived is provided for reference, research or recordkeeping purposes. It is not subject to the Government of Canada Web Standards and has not been altered or updated since it was archived. Please "contact us" to request a format other than those available.
Trends in Dropout Rates and the Labour Market Outcomes of Young Dropouts
Jason Gilmore
Labour Statistics Division
Statistics Canada
Dropout rates continue to fall, but more slowly in recent years
Dropping out of high school has declined in all provinces since the early 1990s
Dropout rates in the territories highest in Canada
Dropout rates continue to be high outside big cities
Young men continue to have higher dropout rates than young women
Aboriginal youth had much higher dropout rates than non-Aboriginal youth
Immigrant youth had lower dropout rates than Canadian born
Labour market outcomes of dropouts compared to high school graduates
One in four dropouts were unemployed during the recent downturn
The average full-time employed dropout earned $70 less per week than their graduated peers in 2009/2010
Most dropouts were in private sector jobs such as trades, sales and service
Conclusion
Canadians generally place a high value on education. There are any number of reasons, however, why some young Canadians in their early 20s have not graduated from high school. Previous studies have shown that young men, young people in Quebec and in some Western provinces, and those living outside of large cities were more likely to have not completed high school.1, 2, 3, 4 These same studies have shown, however, that dropout rates have been steadily falling from the early 1990s to the mid-2000s.
Building and expanding on this previous research, this article examines the trends and patterns in dropout rates up to 2009/2010. In addition, national data for both Aboriginal people and immigrants are now available from the Labour Force Survey, allowing researchers to assess how dropout rates differ between these groups and the rest of the population.
Understanding the economic situation of dropouts is also important, as it illustrates how the labour market outcomes for young people who have completed a high school education differ from those who dropped out. This is particularly important in times of economic downturn, as has occurred recently, since it is often young people in the labour market who are heavily impacted by such downturns.
Box 1:
Using the Labour Force Survey to measure dropout rates
While the primary purpose of the Labour Force Survey (LFS) is to produce estimates of employment and unemployment (the LFS is the official source of unemployment data at Statistics Canada), this survey also includes important demographic and education information.
The main education estimates produced using the LFS concern the educational attainment of the population, as well as school attendance estimates. Combining these two estimates and using the age of respondents, one can calculate a "dropout rate."
Although typical high school graduates will finish their secondary education by the age of 18, some do not, for a variety of reasons. Some return to school, taking advantage of 'second chance' opportunities for completing high school that are available across the country. However, by the age of 20 to 24, they typically have decided to return to complete their high school education or not. Therefore, dropout rates are commonly calculated using this age group; to estimate dropout rates using a younger group might be to count as a "dropout" those only temporarily stopping their schooling.
Since the LFS is a sample survey subject to some inherent error, particularly among smaller geographies, provincial dropout rates are averaged over three-year periods. This is done to improve the confidence in the trend. At the national level, no averaging was used.
Dropout rates continue to fall, but more slowly in recent years
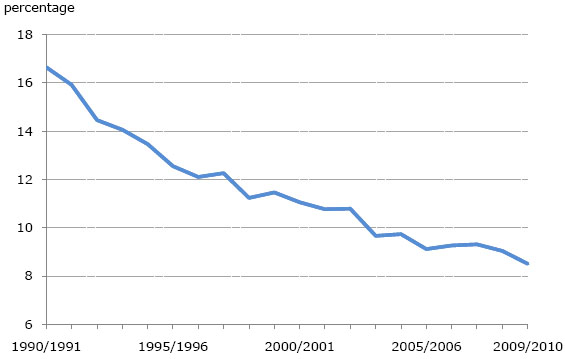
Beginning in 1990/1991, when Canada's Labour Force Survey first started collecting data that allowed the calculation of high school dropout rates, nearly 340,000 young people aged 20 to 24, or one out of every six (16.6%) had not obtained a high school diploma and were not enrolled in school. Since that time, dropout rates have been falling (Chart 1). The largest declines happened during the 1990s; by 2000/2001, 225,000 or one in nine (11.1%) young people had dropped out of high school. The dropout rate decreased more gradually during the 2000s. By 2009/2010, one in 12 or 8.5% of 20- to 24-year-olds had not obtained their high school diploma.
Chart 1
Dropout rate, non-students aged 20 to 24, 1990/1991 to 2009/2010
Source: Statistics Canada, Labour Force Survey.
Dropping out of high school has declined in all provinces since the early 1990s
Among those aged 20 to 24, the high school dropout rate fell in all provinces from the early 1990s to the late 2000s (Table 1). Most of the Atlantic provinces had the greatest change from 1990 to 2000: rates fell from a range of 15% to 20% in the early 1990s to 9% to 11% a decade later. Since then, the dropout rates for these provinces have fallen even further.
Newfoundland and Labrador had the most significant change in dropout rates over the past 20 years. In 1990/1993, Newfoundland and Labrador had the highest dropout rate in Canada (19.9%); by 2007/2010, it had one of the lowest (7.4%). Dropout rates were lowest in British Columbia in 2007/2010, at 6.2%. and highest in Quebec, at 11.7%, followed closely by the three Prairie provinces. That being said, these rates were still significantly lower than those prevailing in 1990/1993.
| 1990/1993 | 2007/2010 | |||
|---|---|---|---|---|
| thousands | percent | thousands | percent | |
| Newfoundland and Labrador | 10.0 | 19.9 | 2.2 | 7.4 |
| Prince Edward Island | 1.8 | 18.9 | 0.9 | 8.9 |
| Nova Scotia | 11.9 | 17.8 | 5.2 | 8.6 |
| New Brunswick | 8.6 | 15.4 | 3.8 | 8.1 |
| Quebec | 84.2 | 17.4 | 55.5 | 11.7 |
| Ontario | 114.3 | 14.8 | 68.6 | 7.8 |
| Manitoba | 12.4 | 16.0 | 9.1 | 11.4 |
| Saskatchewan | 10.4 | 16.2 | 6.7 | 9.4 |
| Alberta | 30.7 | 15.7 | 28.3 | 10.4 |
| British Columbia | 31.5 | 13.3 | 19.1 | 6.2 |
| 1 defined as 20-to 24-year-olds without a high school diploma and not in school Note: due to small sample sizes in many provinces, all provincial data are based on a 3-year average (1990/1993 and 2007/2010). Source: Statistics Canada, Labour Force Survey. |
||||
Dropout rates in the territories highest in Canada
Dropout rates among 20- to 24-year-olds in the three territories were persistently higher than those of the provinces. Yukon's rate was 20.0% in 1992/1995 and 15.5% in 2007/2010. In the Northwest Territories, the rate was roughly unchanged over time, at 28.4% in 2001/2004 and 30.1% in 2007/2010. Nunavut had the highest dropout rate of all provinces and territories, at 50.0%, in 2007/2010.
Dropout rates continue to be high outside big cities
Based on a three-year average covering the school months from September 2007 through April 2010, the high school dropout rate of 20- to 24 year-olds living outside of Canada's largest cities was nearly double that of those living within the big cities (15.5% vs. 7.9%), or a gap of 7.6 percentage points. In 2007/2010, the overall dropout rate gap between large cities and elsewhere was little changed from what it was in the 2001/2004 period (9.4% vs. 16.2%, respectively, for a gap of 6.8 percentage points). It is those in smaller towns who contributed more to the dropout rate than young people in more sparsely populated settings, at 14.5% vs. 16.1%, respectively, in 2007/2010.
Young men continue to have higher dropout rates than young women
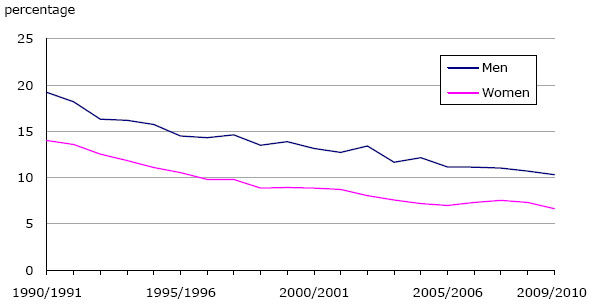
In 2009/2010, 10.3% of young men and 6.6% of young women had dropped out of high school (Chart 2 and Table 2). The rates for both young men and young women were down significantly from 1990/1991, when 19.2% of young men and 14.0% of young women had dropped out of high school. The gap between the dropout rates of young men and women narrowed slightly over time, moving from 5.2 percentage points in 1990/1991 to 3.7 percentage points in 2009/2010, as the share of young men dropping out fell faster over this period.
Previous studies have given some indications of the differing reasons why young men and women decide to drop out before completing high school.5 Young men tended to report that they dropped out because they were not engaged in school and/or wanted to work and earn money. Young women, on the other hand, were more likely to drop out because of personal or family reasons, such as pregnancy or having a young child at home.6, 7
Chart 2
Dropout rate, population aged 20 to 24, by sex, 1990/1991 to 2009/2010
Source: Statistics Canada, Labour Force Survey.
| Canada | Dropouts | Dropout rate | ||||
|---|---|---|---|---|---|---|
| Total | Men | Women | Total | Men | Women | |
| thousands | percent | |||||
| 1990/1991 | 337.5 | 196.7 | 140.8 | 16.6 | 19.2 | 14.0 |
| 1991/1992 | 320.2 | 185.1 | 135.2 | 15.9 | 18.2 | 13.6 |
| 1992/1993 | 289.2 | 165.3 | 123.9 | 14.5 | 16.3 | 12.6 |
| 1993/1994 | 278.8 | 162.7 | 116.1 | 14.1 | 16.2 | 11.9 |
| 1994/1995 | 264.8 | 157.0 | 107.8 | 13.5 | 15.8 | 11.1 |
| 1995/1996 | 245.5 | 143.7 | 101.7 | 12.5 | 14.5 | 10.5 |
| 1996/1997 | 237.0 | 142.2 | 94.8 | 12.1 | 14.3 | 9.8 |
| 1997/1998 | 241.3 | 146.2 | 95.1 | 12.3 | 14.6 | 9.8 |
| 1998/1999 | 222.7 | 136.4 | 86.4 | 11.2 | 13.5 | 8.9 |
| 1999/2000 | 230.1 | 142.1 | 88.0 | 11.5 | 13.9 | 8.9 |
| 2000/2001 | 225.7 | 137.0 | 88.8 | 11.1 | 13.2 | 8.9 |
| 2001/2002 | 224.0 | 134.9 | 89.1 | 10.8 | 12.7 | 8.7 |
| 2002/2003 | 228.4 | 144.7 | 83.7 | 10.8 | 13.4 | 8.1 |
| 2003/2004 | 208.1 | 127.8 | 80.2 | 9.7 | 11.7 | 7.6 |
| 2004/2005 | 211.9 | 134.9 | 77.0 | 9.7 | 12.2 | 7.2 |
| 2005/2006 | 200.6 | 125.0 | 75.6 | 9.1 | 11.2 | 7.0 |
| 2006/2007 | 205.2 | 125.6 | 79.6 | 9.3 | 11.1 | 7.3 |
| 2007/2008 | 206.7 | 124.5 | 82.1 | 9.3 | 11.0 | 7.5 |
| 2008/2009 | 201.1 | 121.1 | 79.9 | 9.0 | 10.7 | 7.3 |
| 2009/2010 | 190.8 | 117.6 | 73.2 | 8.5 | 10.3 | 6.6 |
| 1 defined as 20- to 24-year-olds without a high school diploma and not in school Source: Statistics Canada, Labour Force Survey. |
||||||
Aboriginal youth had much higher dropout rates than non-Aboriginal youth
Previous research into the dropout rates for Aboriginal people indicated that young Aboriginal people were more likely to drop out than non-Aboriginals.8, 9 According to Labour Force Survey data, for 2007/2010, the dropout rate among First Nations people living off-reserve, Métis and Inuit aged 20 to 24 was 22.6%, compared to 8.5% for non-Aboriginal people. By Aboriginal group, the dropout rate among young off-reserve First Nations people (North American Indians) was 25.8%, and for Métis, 18.9%.
Immigrant youth had lower dropout rates than Canadian born
Thanks to additional questions on immigration added to the Labour Force Survey in 2006, it is now possible to analyse data on immigrants in the labour market. In 2006/2007, the dropout rate for immigrant youth between the ages of 20 and 24 was 7.0%, which was lower than the 9.8% rate for Canadian-born youth. Since then, both immigrant and Canadian-born rates declined slightly to 6.2% and 9.1%, respectively, in 2009/2010. The low dropout rate for immigrants is likely due, at least in part, to the high value that both immigrant youth and their parents place on education.10 There also seems to be an association between the high concentration of immigrants in large cities and the fact that young people (Canadian born or immigrant) living in large cities are less likely to drop out of high school than those living outside these cities.
When examining the data by an immigrant's period of landing, 20- to 24-year olds who had landed in Canada more than 10 years prior to the 2007/2010 period were the least likely to have dropped out of high school (5.6%). Those who landed within the previous 10 years were slightly more likely to drop out before completing high school (7.2%), though their dropout rate was still lower than that of Canadian-born youth. There is some research that supports the difference in dropout rates based on an immigrant's period of landing; specifically it states that those who landed in Canada at a young age generally had a higher level of schooling than those who landed as teenagers.11
Labour market outcomes of dropouts compared to high school graduates
An earlier study that looked at the labour market outcomes of dropouts revealed that, despite having a high rate of being active in the labour market, they tended to have trouble landing a job.12 Given that periods of economic downturn have a disproportionate impact on young people's employment status and that Canada went through such a time in late 2008 and much of 2009, it is worth examining a broad range of labour market outcomes of both dropouts and graduates.
One in four dropouts were unemployed during the recent downturn
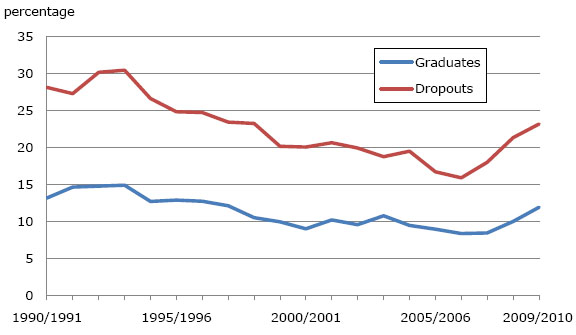
In 2007/2008, prior to the recent downturn, the unemployment rate for dropouts aged 20 to 24 was 18.0%, more than double that of high school graduates of the same age who were not enrolled in an educational institution (8.4%) (Chart 3).
During the deepest part of the downturn, in 2008/2009, the unemployment rate for dropouts rose to 21.3%. During the tail end of the downturn and into the early recovery, in 2009/2010, their unemployment rate remained high, at 23.2%. Meanwhile, the unemployment rates for high school completers who were not in school rose to 10.0% in 2008/2009 and edged up to 11.9% in 2009/2010. Thus, during the deepest part of the downturn, not only was one in four dropouts aged 20 to 24 unable to find work, but the gap between their unemployment rate and that of their counterparts who had completed high school widened.
Chart 3
Unemployment rate, high school graduates and dropouts aged 20 to 24, 1990/1991 to 2009/2010
Source: Statistics Canada, Labour Force Survey.
The average full-time employed dropout earned $70 less per week than their graduated peers in 2009/2010
The labour market impact of not completing high school goes beyond struggles to find work. Even those who were employed tended to have lower job quality and financial benefits than high school completers.
In 2009/2010, dropouts employed full time were working almost one hour more per week than high school graduates who were not in school (39.9 hours vs. 39.2 hours), yet they were earning $70 less per week, on average ($551 vs. $621) (Table 3). Similar wage disparities between those with and without a high school diploma have been found in other research.13
When looking at median weekly earnings – where half are earning less than and the other half earning more than that figure – the disparity between dropouts and graduates aged 20 to 24 was even larger. In 2009/2010, the median weekly earnings of full-time employed dropouts was $480, while their counterparts with a high school diploma had median weekly earnings of $577 – a difference of $97.
| Dropouts | High school graduates not in school |
|
|---|---|---|
| Full time/part time | percent | |
| Employed full time | 82.5 | 83.1 |
| Part-timers working part time involuntarily | 60.9 | 65.3 |
| hours | ||
| Usual weekly hours, employed full time | 39.9 | 39.2 |
| Class of worker | percent | |
| Public sector employee | 3.3 | 10.7 |
| Private sector employee | 91.9 | 85.1 |
| Self-employed | 4.7 | 4.2 |
| Weekly wages, full-time employee | dollars | |
| Average weekly wages | 551 | 621 |
| Average weekly wages, public employee | 685 | 728 |
| Average weekly wages, private employee | 546 | 608 |
| Median weekly wages | 480 | 577 |
| Selected occupations, share | percent | |
| Business/finance/administration | 6.4 | 15.2 |
| Sales and service | 42.0 | 33.8 |
| Trades, transport, equipment operators | 30.4 | 20.1 |
| Unique to primary industries | 7.0 | 3.3 |
| Unique to manufacturing/processing | 7.5 | 4.6 |
| All others | 6.7 | 23.0 |
| Other employment characteristics | percent | |
| Union coverage | 14.4 | 20.4 |
| Temporary/casual job | 15.0 | 18.2 |
| Source: Statistics Canada, Labour Force Survey. | ||
Most dropouts were in private sector jobs such as trades, sales and service
Other differences between jobs held by dropouts and by non-student high school graduates relate to the class of worker and type of occupation.
In 2009/2010, dropouts were much less likely to be employed in the public sector than their graduate counterparts (3.3% vs. 10.7%) and more likely to be private sector employees (91.9% vs. 85.1%). Although some public sector jobs pay more than some private sector jobs, the weekly wage gaps between dropouts and graduates persisted regardless of their class of work.
In 2009/2010, compared with non-student high school graduates, dropouts aged 20 to 24 represented a lower share of those working in business and administrative occupations and a higher share of those in the following areas: sales and services; trades, transport and equipment operators; and occupations unique to primary industry or manufacturing.
Employed dropouts were also less likely to have some kind of union coverage at work. In 2009/2010, 14.4% of dropouts were covered by a collective agreement at work, compared with 20.4% of high school graduates. This is likely influenced by the class of worker (i.e., private vs. public sector) and types of occupations dropouts belong to compared to graduates.
In 2009/2010, the share of employed dropouts working full time was not much different from that of graduates (82.5% vs. 83.1%).
Among those who were working part-time, dropouts were slightly less likely to be doing so involuntarily (60.9% vs. 65.3%). As well, high school dropouts were slightly less likely to be in a temporary job than high school graduates who were not in school (15.0% vs. 18.2%).
Conclusion
High school dropout rates among Canadians aged 20 to 24 have decreased significantly throughout the 1990s and 2000s. This has been especially evident in the Atlantic Provinces and British Columbia, though significant declines are also evident in the other provinces. Dropout rates remain persistently high, however, in the territories.
In the early 1990s, dropout rates were much higher among young men than among young women. The rates decreased over time for both males and females, though the rate of decrease was faster for males, resulting in a narrowing of the gap. Nevertheless, the dropout rate continues to be lower for females. Other differences observed are the lower dropout rate for immigrant youth compared to Canadian born and the higher dropout rate for Aboriginal youth compared to non-Aboriginal youth.
Even though dropout rates are much lower than they were 20 years ago, both across the provinces and for both men and women, there are still concerns about the labour market impacts of dropping out before completing high school. About one in four dropouts aged 20 to 24 who were in the labour market in 2009-2010 were unable to find jobs–a situation that worsened with the recent economic downturn. Even among those who did find work, their earnings were less than those with a high school diploma, regardless of whether they worked in the public or private sector.
Notes
-
Bowlby, Geoff. 2005. "Provincial Dropout rates - Trends and Consequences." Education Matters, Statistics Canada Catalogue no. 81-004-XIE, Vol. 2 No. 4.
-
Bowlby, Jeffrey and McMullen, K. 2002. At a Crossroads: First Results for the 18 to 20-year old Cohort of the Youth in Transition Survey. Human Resources Development Canada and Statistics Canada. Statistics Canada Catalogue no. 81-591-XIE
-
Raymond, Melanie. 2008. "High School Dropouts Returning to School". Culture, Tourism and the Centre for Education Statistics Research Papers. Statistics Canada Catalogue no. 81-595-M No. 55.
-
Human Resources and Skills Development Canada. "Learning - School dropouts."
http://www4.hrsdc.gc.ca/.3ndic.1t.4r@-eng.jsp?iid=32, accessed on June 28, 2010. -
Gingras, Yves. 2002. "The Costs of Dropping out of High School", Pan-Canadian Education Research Agenda Symposium Report.
http://cesc-csce.ca/ pceradocs/ 2000/ 00Gingras_e.pdf, accessed on August 24 2010 -
Bushnik, Tracey. 2003. "Learning, Earning and Leaving: The relationship between working while in high school and dropping out". Education, skills and learning - Research papers. Statistics Canada Catalogue no. 81-595-MIE, No. 4.
-
Abada, Teresa, Hou, F. and Ram, B. 2008. "Group Differences in Educational Attainment Among the Children of Immigrants." Analytical Studies Branch Research Paper Series. Statistics Canada Catalogue no.11F0019M- No. 308.
-
Schaafsma, Joseph, and Arthur Sweetman (2001) "Immigrant Earnings: Age at Immigration Matters." Canadian Journal of Economics, November 2001, v. 34, issue 4, p. 1066-99.
-
Ferrer, A.M and W.C. Riddell. 2002. "The Role of Credentials in the Canadian Labour Market." Canadian Journal of Economics, vol. 35 no. 4 897-905.