
Statistics Canada
www.statcan.gc.ca
Common menu bar links

Archived Content
Information identified as archived is provided for reference, research or recordkeeping purposes. It is not subject to the Government of Canada Web Standards and has not been altered or updated since it was archived. Please "contact us" to request a format other than those available.
Women in Non-traditional Occupations and Fields of Study
Kathryn McMullen, Jason Gilmore and Christel Le Petit
Statistics Canada
Occupational change among women
Changes in patterns of participation of women in postsecondary education
Conclusion
The situation of women in Canadian society and in the labour market has undergone a massive shift over the past few decades. Women now account for the majority of university graduates; the gender gap in labour market participation in 2009 narrowed to a small fraction of its size in 1976; and increasingly, women are found in non-traditional occupations and fields of study. That being said, there still are many occupations that reflect historical gender roles. That is because fundamental societal shifts like these typically take place over an extended period of time, reflecting changes in behaviours of successive cohorts of young people.
This article takes stock of changes that have taken place over time in the occupations held by women in the labour market and in the fields of study they are choosing at the postsecondary level. It demonstrates where changes have occurred and suggests where change may happen in future as a result of shifts in the composition of postsecondary education graduates.
We note at the outset that there is no standard definition of what constitutes a ‘non-traditional’ occupation or field of study for either women or men. The usual practice, adopted in this article, is to consider as ‘non-traditional,’ occupations or fields of study in which a specific group accounts for a relatively small percentage of the overall total. Engineering and many of the trades are examples of non-traditional employment for women, since they typically account for less than 10% of all workers in those fields.
Occupational change among women
Increasing numbers of women have entered into paid employment over the past 30 years, substantially narrowing the gap in labour market participation with men (Chart 1). As a result, women have increased their share of employment in almost all occupations.
Chart 1
Labour force participation rates, men and women aged 25 to 64, 1976 to 2009
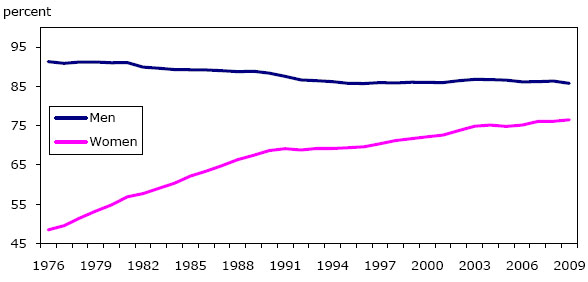
Source: Statistics Canada. Labour Force Survey.
However, the occupational profiles of women and men show important differences. In 2009, for example, over half of women were found in two occupational groups: sales and services and business, finance and administration (Chart 2). Women were also more likely than men to work in occupations in social services, education, government services and religion, and in health. In contrast, men continued to predominate in occupations in trades, transport and equipment operators and, to a lesser extent, in occupations in the natural and applied sciences; management; and occupations unique to manufacturing, processing and utilities.
Chart 2
Percentage distribution of males and females aged 25 to 64 across major occupational groups, 2009

Source: Statistics Canada. Labour Force Survey.
Nevertheless, changes have taken place in the occupational profile of women over time. These are particularly evident when looking at more detailed occupational breakdowns rather than at the major-group level.1 For example, between 1996 and 2006, the share of women rose from a minority to a majority situation in six occupations. Notable gains were made in human resources and business services professionals; administrative services managers; and managers in other services. Other occupations where the share of women rose to over half over this period were: machine operators and related workers in textiles; managers in art, culture, recreation and sport; and insurance and real estate sales.
In addition, notable gains in the share of women were observed in a number of other occupations between 1996 and 2006 (Chart 3). Given the small representation of women in these occupations at the beginning of the period, these are considered to be ‘non-traditional’ occupations for women. Significant gains in the female share of employment between 1996 and 2006 are observed for: sales, marketing and advertising managers; physical science professionals; technical occupations in architecture, drafting, surveying and mapping; managers in engineering, architecture, science and information systems; and police officers and fire-fighters.
Chart 3
Non-traditional occupations in which women increased their share of employment between 1996 and 2006

Source: Statistics Canada. Census of Canada, 1996 and 2006.
Overall, occupations in the trades tend largely to be non-traditional occupations for women. In 2007, for example, out of a total 24,495 individuals who completed an apprenticeship training program, females accounted for 2,780 or 11%. This proportion has been more or less steady since the mid-1990s but has increased from 1991 when it was 6%. However, in most of the major trade groups in 2007, the proportion of females was quite low, at between 1% and 2% of completions.2
Women accounted for very large shares of completions in 2007 in two major trade groups – in the food and services and ‘other trades’ groups, at 79% and 62%, respectively. In the food and services trade group, about two thirds of total female completers came from the hairstylist/hairstyling program. In other words, increases in the shares of women in the trades largely reflect growth in traditionally ‘female’ occupations.
Changes in patterns of participation of women in postsecondary education
The long-term trend toward the greater participation of women than men in postsecondary education is well-established, but that has not always been the case.
Examination of the percentage of the population with a postsecondary education by age group shows that among the older age groups (aged 65 years or more), there was a large gender gap, with much larger shares of men holding a postsecondary credential than women. That gap began to narrow as baby-boomers, especially women, began to attend college and university in greater numbers. This narrowing of the gender gap is evident in Chart 4, which shows strong increases in the percentage of women with a postsecondary education among individuals who were aged 55 to 64 in 2006. This trend continued with subsequent cohorts such that among 35 to 44 year-olds and especially, 25 to 34 year-olds in 2006, the share of women with a postsecondary education surpassed that of men.
Chart 4
Share of population with a postsecondary education, by sex and age group, 2006

Source: Statistics Canada. 2006 Census.
Furthermore, successive cohorts of women are choosing university over college and college over having just high school as their highest level of education. This is reflected in the rising share of university graduates accounted for by women. For example, women accounted for 56% of those who graduated from university in 1992; by 2007, the female share had risen to 61%.
Not only are education levels rising among women, but changes are taking place as well in the fields of study pursued by female university graduates. Women accounted for the vast majority of university graduates in both 1992 and 2007 in fields of study related to health and education. Given the long-term predominance of women in occupations relating to health, they are what would be considered ‘traditional’ fields of study for women. But it is important to note that shifts have been taking place within the health field as well. For example, within the broad field of ‘health and related clinical sciences,’ women accounted for 59% of graduates from medicine (MDs) in 2007, compared to 43% in 1992; similarly, the female share of graduates in dentistry rose from 37% in 1992 to 55% in 2007.
Women also increased their share of graduates from less than 50% in 1992 to over 50% in 2007 in two fields of study – physical and life sciences, and technologies; and agriculture, natural resources and conservation. In fact, women have increased their share of university graduates such that in 2007, they accounted for more than half of graduates in all fields of study, except for three: architecture and engineering; mathematics and computer sciences; and personal, protective and transportation services (Chart 5).
Chart 5
Female share of university graduates, by field of study, 1992 and 2007
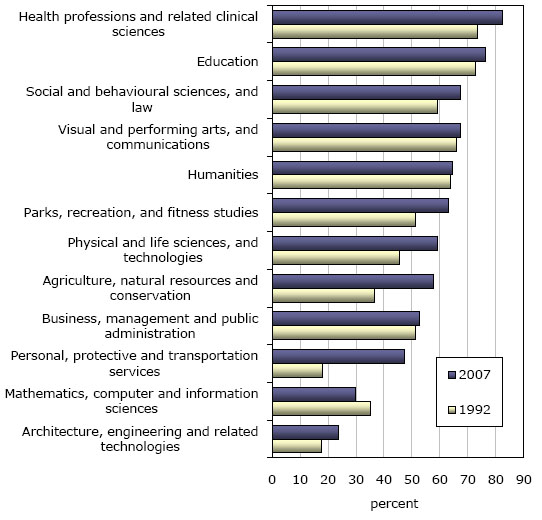
Source: Statistics Canada. Postsecondary Student Information System.
As was the case for occupation, women have made fewer inroads into non-traditional fields of study in the trades. The top five trades in which men had earned a trades certificate accounted for 79% of men in the trades in 2006. In these top-five male-dominated trades, women accounted for 2% of those with trades certificates in mechanics and repairers and in construction trades; for 3% of certificates in the precision production trades; for 7%, in transportation and materials moving; and for 10%, in engineering technology.
In contrast, the fields of study in which women with trades certificates in 2006 predominated were those in: family and consumer sciences/human sciences; health services/health sciences; business, administrative and related support services; and personal and culinary services.
Conclusion
Altogether, the past decades have seen fundamental shifts take place in the nature of female participation in the labour market. While women still predominate in what may be considered to be traditionally female occupations, they have also made gains in a number of non-traditional occupations as well.
An important factor behind these shifts has been the steep rise in educational attainment among women. This is especially the case at the university level. Furthermore, successive generations of young women are graduating with university degrees in ‘non-traditional’ fields of study. This would suggest that changes in the occupations held by women will continue to be observed over time.
That being said, there are some segments of the labour market where little change has taken place. This is especially the case for occupations in the trades, where, with few exceptions, men still account for the vast majority of trade certificate holders.
Notes
-
The National Occupational Classification, like other classification systems, is organized hierarchically. Within each broad occupational category, one or more major groups are identified; within each major group, one or more minor groups are identified and within each minor group one or more unit groups. This structure is expressed in the coding system. For more information, see National Occupational System – Statistics (NOC-S) 2006.
-
Skof, Karl. 2010. "Trends in the Trades: Registered Apprenticeship Registrations, Completions and Certification, 1991 to 2007." Education Matters, Vol. 6 no. 6. Statistics Canada Catalogue no. 81-004-X.
www.statcan.gc.ca/pub/81-004-x/2009006/article/11127-eng.htm (accessed March 30, 2010).