75-001-XIE

 |
December 2002 Vol. 3, no. 12 |
The labour market: Up north, down south
Geoff Bowlby and Jeannine Usalcas
Unless otherwise noted, all data are seasonally adjusted and as of December 3, 2002.
Few major economies are as intertwined as those of Canada and the United States. In fact, they are often viewed as one common North American economy-and with good reason. During the recessions of the 1980s and 1990s, when the U.S. economy suffered, so did the Canadian-and to a greater degree. Indeed, it is often said that when the United States catches a cold, Canada gets the flu.
With the introduction of the Canada-U.S. Free Trade Accord and then NAFTA, some expected that the inevitable progression of economic linkages would leave Canada even more susceptible to the ups and downs of the American economy. However, the very rapid expansion of the economy and labour force in Canada in 2002 stands in contrast to the relative stagnation south of the border.
While the U.S. went into official recession in 2001, Canada showed only one quarter during which its economy shrank. Not since 1974 has the economy grown in Canada while contracting in the United States. Not only was 2001 much worse for the American economy, which bottomed out in the third quarter, but since then economic growth has been stronger in Canada.
The divergence is even more apparent in labour market trends than in the overall economic trends. While Canadian employment eked out a small gain in 2001 and saw an explosive growth in the first half of 2002, U.S. employment dropped sharply in 2001 and was flat for the first half of 2002. This article documents and helps explain the key economic and labour market trends in both countries.
The North American economy slipped in 2001, mostly in the United States
The 2001 economic contraction in the United States was unique in that it did not seem to affect Canada as much as past downturns (Chart A). In the downturn of the early 1980s, ![]() 1 the U.S. economy shrank by 2.9%, while gross domestic product (GDP) in Canada decreased 3.3%. During the early 1990s, a similar story occurred. GDP in the U.S. fell 1.5%, much less than the 3.0% drop in Canada.
1 the U.S. economy shrank by 2.9%, while gross domestic product (GDP) in Canada decreased 3.3%. During the early 1990s, a similar story occurred. GDP in the U.S. fell 1.5%, much less than the 3.0% drop in Canada.
But during the 2001 downturn in the United States, the Canadian economy expanded slightly. While GDP in the U.S. declined 0.6% between the last quarter of 2000 and the third quarter of 2001, it actually increased by 0.1% in Canada. This was much slower than growth during the 1997 to 2000 period, but growth nevertheless.
Not only did Canada fare better than the U.S. in the first three quarters of 2001, but when both economies began to pick up in the fourth quarter, Canada's economic growth was much stronger. From the third quarter of 2001 to the third quarter of 2002, GDP increased by 4.0% in Canada, compared with 3.2% in the United States.
Implications for the labour market
As both economies weakened during the U.S. downturn, so too did the labour markets (Chart B). While the economy in the U.S. shrank during the first three quarters of 2001, employment contracted during the full 12 months of the year, dropping 1.1% (-1.4 million). During the same period in Canada, payroll employment increased by a scant 0.9% (+108,000). ![]() 2
2
The weakened job situation caused unemployment rates to rise in both countries. As the Canadian rate (see Unemployment) increased from 6.0% to 7.1% at year-end, the rate in the U.S. rose from 4.0% to 5.8%. Had it not been for a drop in labour force participation in the U.S., the U.S. unemployment rate would have increased by more. In Canada, labour force participation ended the year unchanged (Chart C).
As a result of the relative strength of the Canadian economy in 2002, significant employment gains were made, but in the United States the employment trend was flat. In the first seven months of the year, employment in Canada increased 290,000 (+2.3%) while in the U.S., it was down 99,000 (-0.1%). The unemployment rate in Canada declined as a result, hitting 6.8% by July, down 0.3 percentage points from December 2001. In the U.S., the unemployment rate in July was 5.9%, up slightly from 5.8% at the start of the year.
The continued strength in the Canadian labour market and weakness in the U.S. narrowed the employment rate gap between the two. For nine years (1992 to 2000), the difference between the Canadian and U.S. employment rates was 2 to 4 percentage points. By July 2002, the gap had narrowed to 0.2 percentage points, the smallest since 1988.
These labour market changes also affected rates of participation, as a greater percentage of Canadians than Americans were in the labour market by mid-2002. The last time the Canadian participation rate was higher was in 1991.
Why was this downturn so different?
Compared with the 1990s recession, the 2001 contraction of the economy was much milder-to a large extent because North American consumers continued to spend. The 1990s recession, on the other hand, was characterized by a drop in consumer spending and housing demand in the United States, and an outright collapse in Canada.
The main drag on the two economies in 2001 was the reduction in business spending (Chart D). In the U.S., the drop in private investment was much deeper. By the end of the third quarter of 2001, private investment in the United States had fallen 11%, much more than the 2% drop in Canada.
Falling business investment directly affects the labour market.
Falling business investment had some direct effect on the labour markets in both countries, but more so in the United States. Employment in the manufacture of industrial machinery and electronic products in Canada fell by 7.1% between December 2000 and December 2001-a large drop, but not as big as the 11.0% slide in the United States.
Overall, manufacturing was one of the main sources of divergent trends in employment in 2001 (Chart E). In the U.S., where manufacturing employment growth had been very weak for a number of years, manufacturing employment dove 7.1% (-1.3 million), but in Canada it fell only 3.0% (-61,000).
..but machinery and equipment manufacturing employment not the only source of divergence
Much of the divergence resulted from the smaller decline in industrial machinery and electronic product employment-not from differing trends in auto and auto parts employment (Table 1). In the U.S., sales of automobiles and light trucks fell somewhat through 2000 and into 2001. As a result, production at U.S. and Canadian plants slowed and employment fell. In both countries, employment in transportation equipment dropped 6.2% in 2001. In the United States, transportation equipment employment had already been on a downward trend since late 1998 but in Canada, employment in the industry had been rising.
In line with declining automotive production, employment at metal producers fell in both countries in 2001, but the decline in Canada (-2.6%) was significantly less than in the United States (-8.0%). In the face of increased international competition and falling profits, numerous U.S. steel companies filed for Chapter 11 bankruptcy in 2001-most notably, Bethlehem Steel. ![]() 3
3
The greater decline of the U.S. manufacturing sector had larger, negative, spin-off effects in the transportation industry. In the U.S., transportation employment fell 4.9% compared with only 0.3% in Canada. In 2001, trucking employment in the U.S. dropped 1.7% while increasing 3.3% in Canada.
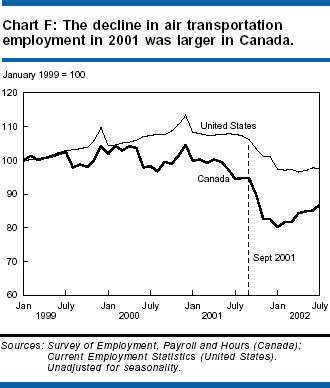
Earlier adjustments in the Canadian airline industry
The gain in trucking employment in Canada was enough to offset the drop in air transportation, a drop that was proportionately larger in Canada than in the United States. In Canada (Chart F), the air transportation industry began to cut back staff early in the year, beginning a downward trend that undoubtedly accelerated after the collapse in travel following September 11. In the U.S., almost all of the year's losses occurred in the September to December period, when the Bureau of Labor Statistics noted the largest air transportation employment decline on record.
Who was most affected in 2001?
With the employment loss in the United States (-1.1%) and weak growth in Canada (+0.9%) came increased unemployment rates in both countries in 2001 (Table 2). In the U.S., the rate increased 1.8 percentage points to end the year at 5.8%, while in Canada the rate increased 1.1 points to 7.1%.
Youths were particularly hard hit in 2001 in both countries, but more so in the United States. The youth unemployment rate in the U.S. leapt 2.7 percentage points to 11.9%. The Canadian rate, although higher, increased by a more moderate 1.4 percentage points to 12.9%.
The higher youth unemployment rate in Canada was a reflection of greater labour market participation. In fact, a higher proportion of Canadian youth was employed (60% compared with 56%) by December 2001, suggesting an economy in Canada more favourable to youths.
Youth participation rates declined by 2.4 percentage points in the United States compared with 0.4 in Canada (Chart G). By the end of 2001, Canadian youth participation stood at 69.1%, much higher than the 63.6% in the United States.
Two factors more than likely account for the high numbers of American youth not participating in the labour market in 2001. Most importantly, the United States experienced a much stronger labour market contraction. With fewer skills and experience, young workers are among the first to be let go.
Secondly, demographics may have played a role. The American youth population has been growing at a faster pace since 1996 (Chart H). From December 2000 to December 2001, it grew by 1.8% compared with only 0.6% in Canada. An increasing youth population in a very tough labour market translates to greater competition for fewer jobs.
Core-age workers
The unemployment rate for core-age workers (25 to 54) increased 1.7 percentage points in 2001 in the U.S., but only 1.0 in Canada. Core-age men in both countries had similar increases, but Canadian women were better able to retain their jobs. Their unemployment rate rose only 0.5 percentage points compared with 1.8 for American women.
The participation rate for core-age workers in both countries scarcely changed in 2001. By December 2001, it had increased 0.1 percentage points to 84.6% in Canada, and decreased 0.2 percentage points to 83.7% in the United States.
Older workers
Labour market changes for older workers (55 and over) were similar in the two countries. The Canadian unemployment rate increased from 3.7% to 5.4% between December 2000 and December 2001; the American rate, from 2.5% to 4.0%.
In both countries, the increase in unemployment rates among older workers was due entirely to rising participation. In fact, employment opportunities improved. The employment rate of American older workers in 2001 increased 0.6 percentage points to 32.2% and 0.5 percentage points to 25.2% for Canadian older workers. These gains were experienced equally by men and women.
What happened in 2002?
From the third quarter of 2001 to the third quarter of 2002, output in Canada increased 4.0%, compared with 3.2% in the U.S. Private investment by Canadian and American firms had yet to rebound in earnest, but significant improvements in residential construction and strong net export growth caused growth in Canada to be much stronger.
As stated earlier, this greater economic growth had a more positive effect on the Canadian labour market. In the first seven months of 2002, the number of employees increased 2.3% (+290,000), whereas in the United States employment during this period was flat (-0.1%). This helped the unemployment rate in Canada drop from 7.1% at the start of the year to 6.8% by July. Had it not been for a huge increase in labour market participation during this period, the unemployment rate would have fallen more. In the United States, the unemployment rate was 5.9% in July, up from 5.8% in December 2001.
The strength of the Canadian economy in 2002: houses and cars
January 2002 saw an explosion of housing construction in Canada as consumers reacted to very low interest rates. That month, Canadian housing starts jumped to 40% above their 1992 levels and hovered there for the first half of the year (Chart I).
The surge in housing starts in Canada led to a huge 13% increase in residential investment following the third quarter of 2001 (Chart J). In the United States, the increase was a more moderate 3%. After running behind U.S. residential investment for a number of years, Canadian investment in the second quarter of 2002 was 24% higher than in 1997, compared with a 21% gain in the U.S.
In Canada, the construction boom had a much greater effect on employment. By July, construction employment was up 1.2% since the start of the year. In the United States, construction jobs fell 1.7% in the same period.
In Canada, the increase in home construction and sales spurred employment in real estate services. Much of the 3.1% increase in finance, insurance, and real estate employment can be attributed to a gain in real estate, as well as to added work at banks-perhaps a reaction to an increase in home financing.
The Canadian construction boom is not the only reason for the faster expansion here. Exports picked up, leading to a rebound in the Canadian manufacturing sector in 2002 (Chart K). Sales and production of automobiles after the third quarter of 2001 were stronger in Canada than in the United States. The rebounding automobile sector contributed greatly to the expansion in exports from Canada during this time.
Driven by low-rate financing and strong pent-up demand, the jump in car dealer sales was significant, up 9.3% to $6.9 billion in the second quarter. This, combined with a 2.9% increase in sales at U.S. car dealers, led to greater automobile and parts production in both countries, but particularly in Canada. Here, automobile shipments jumped 10.1% after the third quarter of 2001, somewhat greater than the 7.8% increase in auto and parts production in the United States.
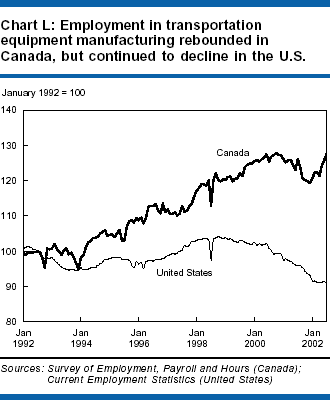
Even though car and parts sales and production increased in the United States, employment in the industry continued on the downward trend that began four years earlier (Chart L). In Canada, however, the employment gain in transportation equipment was significant. In the first half of 2002, it increased 7.0%, compared with a 2.8% drop in the United States (Table 3).
Retail and wholesale trade employment increased a considerable 3.8% in Canada, whereas it was flat in the United States in the first seven months of the year. In Canada, retail trade employment increased 4.5% between July 2001 and July 2002, and a third of this gain can be attributed to added employment at construction product retailers, furniture and appliance stores, and motor vehicle dealers.
Also related to the expansion of automobile production jobs north of the border was a 3.9% gain in metal product manufacturing jobs. In the United States, the problems in that industry persisted into the first seven months of 2002, as metal manufacturers shed another 1.7% of their workforce.
Canada saw an upturn in employment in machinery manufacturing, pushing employment in the broader machinery and equipment sector up 3.4%. In the United States, employment in this industry continued to fall, dropping another 3.6% in the first seven months of 2002. Machinery equipment producers largely service other manufacturers. With the recent gains in manufacturing shipments in Canada being considerably larger (8.2% year-to-date by July) than the gains in the United States (3.5%), one would expect greater hiring at Canadian machinery equipment producers.
Government spending increased in both the United States and Canada following the end of the third quarter 2001. While the spending increase was greater in the U.S. than in Canada, much of it in the U.S. was military-related; in Canada, defence expenditure increases were more moderate. In both countries, the number of armed forces personnel has been on an upward trend ever since the September 11 attacks.
Added spending in health care and social assistance in 2002 in Canada helped contribute to the greater gains in services employment in Canada (Chart M). In the first seven months of the year, health care and social assistance employment increased 2.5%, compared with a 1.5% gain in that sector in the United States. Services to business also increased at a faster pace in Canada than in the U.S. In Canada, the number of employees in business services (such as professional, engineering and legal services) increased 4.7%, considerably more than the 0.6% growth south of the border.
Who was getting the jobs in 2002?
By mid-2002, employment rates in Canada had returned to the highs of December 2000. All major age and sex groups experienced similar employment rate increases with the exception of older men, whose employment rate increased by 1.4 points, much greater than the overall average of 0.8 points.
Employment rates in the United States continued to decline for youth and core-age workers (down almost 1.0 percentage points) through mid 2002, while older workers continued to find employment (1.2 percentage point increase). By July 2002, employment rates in the United States were still approximately 2 percentage points below December 2000 levels.
Unemployment rates in Canada declined for each sex and major age group by mid-2002, although men, youth and older workers had slightly higher than average decreases. In the United States, unemployment rates for men, youth and adult workers continued to increase into 2002.
Increase in part-time work a North American phenomenon
Much discussion has focused on the 'quality' of the employment growth in Canada in the last year-a growing share of employment growth has been part-time rather than full-time (Chart N). Part-time employment grew faster than full-time employment in Canada in the last year, increasing 3.7% from July 2001 to July 2002, compared with a 1.8% increase in full-time employment. The United States saw an even greater increase in part-time employment during the same time, 4.9%.
Even though part-time employment increased, the proportion of employment that is part-time (part-time rate) increased minimally in Canada, from 22.6% in July 2001 to 23.0% in July 2002. In the United States, the part-time rate increased from 16.0% to 16.9% over the same period.
The regional perspective
Only two provinces experienced a net decline in employment in 2001 (Figure): British Columbia (-61,000) and Saskatchewan (-15,000). British Columbia's losses were caused mainly by a lumber production slowdown or halting of operations, while Saskatchewan experienced falling farm employment, a trend that started in 2000.
Most provinces, however, experienced an unemployment rate increase, except Manitoba and Newfoundland and Labrador where unemployment rates decreased minimally (0.4 percentage points). Quebec and British Columbia had the highest increases-1.7 and 2.8 percentage points respectively between December 2000 and December 2001.
By July 2002, employment had increased for 9 of the 10 provinces, with Ontario, Quebec, British Columbia, and Alberta experiencing the bulk of growth. Eight of the 10 provinces experienced unemployment rate declines by mid-2002. Unemployment rates for Ontario and Manitoba increased minimally from December 2001, by 0.3 and 0.4 percentage points respectively.
In the U.S., employment declines and unemployment increases in 2001 were more widespread. Employment declined in 31 of the 50 states in 2001. New York, Michigan, Illinois, Washington and Georgia were among the hardest hit, accounting for two-thirds of the employment decrease. Unemployment rate increases were even more widespread, as rates rose in 46 of the 50 states, with increases of a full percentage point in 28 states.
The labour market outlook fared better for the first seven months of 2002. Between December 2001 and July 2002, employment declined in only 11 states, and 16 enjoyed increases of over 2%. By mid-2002, New York (1.7%), Washington (2.3%) and Georgia (2.4%), three of the hardest hit in 2001, enjoyed employment increases. Unemployment rates increased in less than half of the states (24), and only two experienced an increase of a full percentage point or more.
Conclusion
The first seven months of 2002 were remarkably positive for the labour market in Canada, but unfortunately, the same cannot be said for the United States. Employment in Canada increased by 2.3% between December 2001 and July 2002, whereas in the U.S., the trend was flat (-0.1%).
Not only were Canadian trends more positive, the state of the labour market in Canada was in better shape. As a result of the relative strength of the Canadian economy, the proportion of the Canadian population working shot above 62%, while it tumbled in the U.S., essentially eliminating the persistent employment rate gap. (However, the full-time employment rate in the United States remained higher than in Canada.) A gap remained in the unemployment rate, but Canada's was higher only because Canadians were more likely to be participating in the labour market.
Data sourcesGeneral trends in unemployment and demographic changes are from the Current Population Survey (United States) and the Labour Force Survey (Canada). Industry employment comparisons use the Current Employment Statistics survey (United States) and the Survey of Employment, Payrolls and Hours (Canada). Local Area Unemployment Statistics were used for state analysis. More information on the U.S. surveys can be found on the Bureau of Labor Statistics Web site at www.bls.gov. The Current Population Survey (CPS) is a monthly household survey with a sample size of approximately 60,000 households. It provides statistics on the labour status (employed, unemployed, and not in the labour force) and demographic characteristics of the civilian non-institutional population 16 years of age and over. The Current Employment Statistics (CES) survey is a monthly, employer-based survey with a sample of over 390,000 establishments. It collects employment, hours, and earnings of payroll jobs in non-farm industries (excluding private households). Estimates from the CES survey refer only to wage and salary workers (employees). Since the CPS sample size is not large enough to provide reliable monthly estimates for all geographic levels, the Local Area Unemployment Statistics (LAUS) program provides monthly estimates of employment and unemployment by geographic detail (some 6,800 areas). The official concepts and definitions are the same as those used in the CPS. Monthly estimates for states are produced using a variety of methodologies, combining current and historical data from several sources-CPS, CES and the unemployment insurance program. The Labour Force Survey (LFS) is a monthly household survey, with a sample size of approximately 53,000 Canadian households. It provides estimates on the labour force status and demographic characteristics of the civilian non-institutional population 15 years of age and over. Estimates are produced at the national, provincial, and sub-provincial levels. Excluded are residents of Yukon, the Northwest Territories and Nunavut; persons living on Indian reserves; full-time members of the Canadian Forces; and inmates of institutions. The Survey of Employment, Payrolls and Hours (SEPH) is the Canadian monthly establishment survey and is based on a census of administrative records (payroll deduction remittances) and the Business Payroll Survey. It collects data on the number of employees paid, payrolls, and hours at detailed industrial, provincial and territorial levels. Excluded are establishments primarily involved in agriculture, fishing and trapping; private households; religious organizations; and military personnel. |
UnemploymentThroughout this article, the Canadian rate has been adjusted to be closer to U.S. concepts of unemployment. For more information on how these adjustments were made, see the Autumn 1998 issue of Labour Force Update (Statistics Canada catalogue no. 71-005-XPB). |
Notes
- In the 1980s, the economic downturn ran from the fourth quarter of 1981 to the third quarter of 1982. In the 1990s, the contraction ran from the third quarter of 1990 to the first quarter of 1991. The 2001 decline occurred over the first three quarters of 2001.
- In this paragraph, the employment figures used are from the Survey of Employment, Payroll and Hours (Canada) and the Current Establishment Survey (United States).
- See David Langdon, Terrance McMenamin and Thomas Krolik, "U.S. labor market in 2001: Economy enters a recession," Monthly Labor Review 125 no. 2 (Washington: Bureau of Labor Statistics, February 2002).
Author
The authors are with the Labour Statistics Division. Geoff Bowlby can be reached at (613) 951-3325 or perspectives@statcan.gc.ca; Jeannine Usalcas at (613) 951-4720 or perspectives@statcan.gc.ca.
|
|
|
|
|
[ Highlights ] [ Main menu | Editor's corner | More news | Contact us | Survey information | Back issues ] [ Statistics Canada home page | In depth | Français ] |
|
© Statistics Canada - Conditions of use |