

 |
|
 |                |
Information identified as archived is provided for reference, research or recordkeeping purposes. It is not subject to the Government of Canada Web Standards and has not been altered or updated since it was archived. Please "contact us" to request a format other than those available.
| Aboriginal peoples living off-reserve in Western Canada Estimates from the Labour Force Survey April 2004 - March 2005 Analysis In 2002, at the request of the Alberta government, Statistics Canada’s Labour Force Survey added questions that made it possible for Aboriginal people living off-reserve to identify themselves as North American Indian, Métis or Inuit. These questions were subsequently added to the LFS in British Columbia, Saskatchewan and Manitoba in April 2004. As a result, for the first time ever, Statistics Canada’s Labour Force Survey is now announcing details about labour market conditions for off-reserve Aboriginal people in the four western-most provinces. Such data were previously available only from the Census. According to the new data, labour market conditions have improved for off-reserve Aboriginal people. However, gaps still persist between the Aboriginal and non-Aboriginal population. During the 12 months ending in March 2005, unemployment rates for Aboriginal people residing in the West were 2.5 times higher than for non-Aboriginal people, on average. Additionally, the transition into the labour market was particularly difficult for Aboriginal youth, those aged 15 to 24. On the other hand, there were a number of positive findings:
This report uses the new LFS data and data from the 2001 Census of Population to analyze the labour market conditions of this population on a province-by-province basis. Effective immediately, key employment data on Aboriginal people living off-reserve will be available on a monthly basis. Steady growth in off-reserve Aboriginal population in West Between 1996 and 2001, the population of Aboriginal people in western Canada grew steadily, especially in urban centres. In 2001 in western Canada, a total of 132,650 Aboriginal people, or 46.7% of Aboriginal people 15 years of age or older, lived in the 8 western census metropolitan areas. Winnipeg, Edmonton, Vancouver and Calgary had the highest numbers of Aboriginal people among the western census metropolitan areas. Saskatoon had the highest concentration of Aboriginal people where approximately 7.1% of the population identified themselves as an Aboriginal person. During the five-year period, the 15+ off-reserve population of Aboriginal people in the West rose 28.4% to 283,890. This was more than four times the rate of growth of 6.6% in the non-Aboriginal population. However, roughly half the growth in the Aboriginal population can be attributed to increased awareness of Aboriginal roots. Improvements for Aboriginal people in recent years On the whole, off-reserve Aboriginal people in western Canada did not have as much success in the labour market in 2004/05 as non-Aboriginal people. Gaps between the employment and unemployment rates for Aboriginal and non-Aboriginal people remained. However, they are shrinking as a result of key improvements in the labour market performance of Aboriginal people. Text table 1
Employment rates have risen in recent years, while unemployment rates have declined. In fact, the share of off-reserve Aboriginal people in the West who had a job increased from 54.2% in 2001 to 57.2% in 2005. Still, this was well below the proportion of 65.2% among non-Aboriginal persons. At the same time, the unemployment rate for these Aboriginal people fell from a high of 16.7% in 2001 to 13.6% in 2005. This was more than twice the rate of 5.3% among non-Aboriginal people. Text table 2
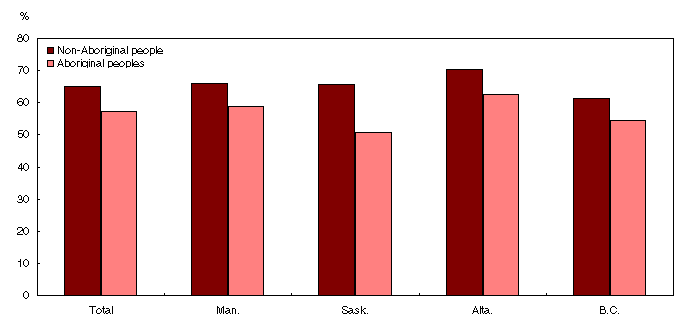
Métis and North American Indians had different experiences in the labour market; Métis were much more likely to be employed than North American Indians. In 2005, the employment rate for Métis was 63.7%, compared with 50.1% for North American Indians. Similarly, the unemployment rate was 10.5% for Métis, and 17.7% for North American Indians. The provinces: Aboriginal people in Alberta fared better While Aboriginal people in Saskatchewan had the most difficulty finding employment, Alberta’s economic prosperity benefited the Aboriginal population along with the non-Aboriginal population. Off-reserve Aboriginal people in Alberta had the highest employment rate (62.6%) and the lowest unemployment rate (10.2%) within the western provinces. In fact, their employment rate was similar to the Canadian average in 2005 of 62.7%. In contrast, Aboriginal people in Saskatchewan faced greater hardship in the labour market. Not only was their employment rate the lowest of all the western provinces at 50.7%, but their unemployment rate was very high at 16.0%. In British Columbia, employment was also low among Aboriginal people at 54.5%, leading to a high unemployment rate of 17.3%. In Manitoba, 58.9% of Aboriginal people had employment compared with 65.9% of non-Aboriginal Manitobans. About 4.8% of the non-Aboriginal labour force was unemployed compared with 11.6% of the Aboriginal labour force. Chart 1

Chart 2

Since the 2001 Census, Manitoba has shown the greatest increase in employment. Its rate has risen from 55.0% to 58.9% in 2005. British Columbia also increased from 51.0% in 2001 to 54.5% in 2005. Aboriginal youth: Tough times in the job market Aboriginal youth, a growing group, struggled to obtain employment in western Canada. According to the 2001 Census, a much greater share of the Aboriginal population was concentrated in the younger age groups compared with the non-Aboriginal population. In western Canada, about 26.6% of the off-reserve Aboriginal persons were in the 15 to 24 age group in 2001, compared with 17.1% of non-Aboriginal persons. While the situation improved for Aboriginal youth in the labour market between 1996 and 2005, this group made few gains since 2001. In 2005, Aboriginal youths in western Canada had difficulty in the labour market, with an employment rate of 43.6%, compared with 61.7% for non-Aboriginal youths. Chart 3

Chart 4

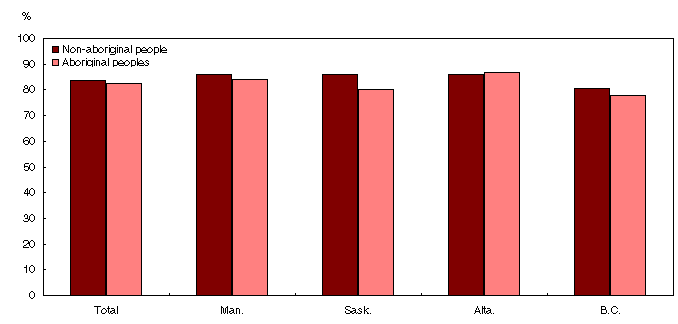
The unemployment rate for Aboriginal youth was more than double that of non-Aboriginal youth – 20.8% compared with 10.0%. Of the four western provinces, Saskatchewan had the lowest employment rate (35.2%) and the highest unemployment rate (24.7%) among Aboriginal youth. Aboriginal youth in Alberta fared best with an employment rate of 49.3% and an unemployment rate of 16.0%. However, they were less successful than non-Aboriginal youths in Alberta, who had an employment rate of 66.9% and an unemployment rate of 7.7%. Education: Levelling the playing field While many Aboriginal people in western Canada had a much harder time in the labour market than their non-Aboriginal counterparts who had completed some form of postsecondary education, such as trade school, college or university, did not. The employment rate for Aboriginal people aged 25 to 64 who had finished postsecondary education was 82.5%, just shy of the 83.5% for non-Aboriginal persons in western Canada. Chart 5

In Saskatchewan, just over six percentage points separated the non-Aboriginal rate of 86.1% from the Aboriginal rate of 80.1%. Both British Columbia and Manitoba showed differences of less than three percentage points. Education also considerably narrowed the gap in unemployment rates. For postsecondary-educated Aboriginal people, the unemployment rate was 6.9% compared with 3.9% for non-Aboriginal people. In comparison, the unemployment rate for all levels of education was 4.4% for non-Aboriginal people and 11.5% for Aboriginal people. Non-Aboriginal people aged 25 to 64 were more likely to have completed postsecondary education than Aboriginal people the same age. In 2005, 55.6% of non-Aboriginal persons had completed some form of postsecondary education, while only 39.9% of Aboriginal persons had done so. Aboriginal people were also less likely to have a university degree and more likely to have a trade certificate or college diploma than non-Aboriginal people. Majority of Aboriginal people working in service-producing industries A high proportion of both Aboriginal and non-Aboriginal people had jobs in the service-producing industries in western Canada. About 75.6% of non-Aboriginal people worked in service-sector industries, compared with 74.1% of Aboriginal people. A slightly higher proportion of Aboriginal people than non-Aboriginal people worked in goods-producing industries - an estimated 26.0% compared with 24.4%. In 2005, the health care and social assistance sector was the largest employer of Aboriginal people in western Canada, employing 11.6% of Aboriginal workers. Other big employers of Aboriginal people were: retail trade (10.8%), accommodation and food services (10.0%), construction (9.4%), manufacturing (9.0%) and public administration (7.1%). |
|||||||||||||||||||||||||||||||||||||||||||||||||||||||||||||||||||||||||||||||||||||||||||||||||||||||||||||||||||||||||||||||||||||||||||||||||||||||||||||||||||||||||||||||||
|
|
|