
Publications
The Canadian Labour Market at a Glance
Hours usually worked

Archived Content
Information identified as archived is provided for reference, research or recordkeeping purposes. It is not subject to the Government of Canada Web Standards and has not been altered or updated since it was archived. Please "contact us" to request a format other than those available.
Usual hours up for women; they are down for men and older workers
-
The average number of usual hours of work continued to fall from 1997 to 2007, even though more full-time workers entered the labour market. The decline was the result of shifts in the distribution of hours in the work week. More people were putting in a work week of 30 to 40 hours, as fewer people were working very long hours (49 or more) or very short hours (under 15).
-
Not only were women more likely to be employed, but their work week increased. In 2007, women worked an average of 33.2 hours a week, up 0.7 hours from 1997. During this period, women shifted from working short- or part-time hours to working 30 to 40 hours a week.
-
In contrast, the work week for men declined 0.7 hours, to an average of 39.5 hours. Instead of working extremely long or extremely short work weeks, they had been working 15 to 40 hours. In 1997, about 16.7% of men of all ages worked 49 hours or more; by 2007, this proportion had declined to 13.8%.
-
Older workers also moved away from working very long hours, and had the largest growth in those working 15 to 39 hours. This brought their standard work week down 0.7 hours to 36.1 hours in 2007.
Chart H.2
Distribution of employment by hours usually worked per week, 1997 to 2007
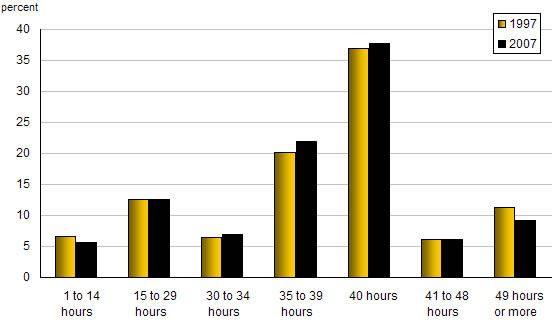
Source: Statistics Canada, Labour Force Survey.
- Date modified: