

 |
|
 |                |
Information identified as archived is provided for reference, research or recordkeeping purposes. It is not subject to the Government of Canada Web Standards and has not been altered or updated since it was archived. Please "contact us" to request a format other than those available.
| Quarterly financial statistics for entreprises
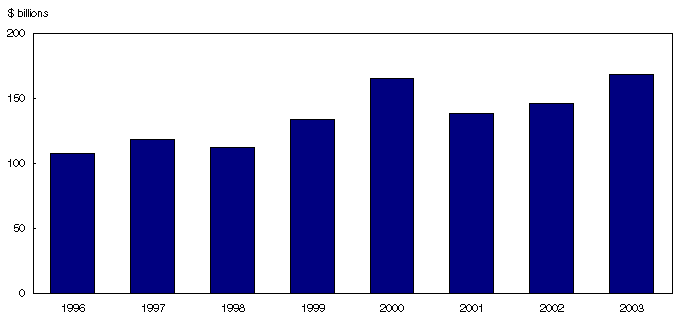
Fourth quarter 2003 Analysis Fourth quarter 2003 and annual 2003 (preliminary) Canadian corporations earned a record $168.3 billion in operating profits in 2003, surpassing the previous high of $165.1 billion earned in 2000. Led by the depository credit intermediaries (mainly chartered banks) and oil and gas producers, sixteen of the twenty-four broad industry showed increases, propelling profits 15.1% over 2002 levels following a 5.6% rise in 2002. Manufacturers endured a turbulent year as their profits slipped 9.2%, reversing most of their 2002 gains. Chart 1

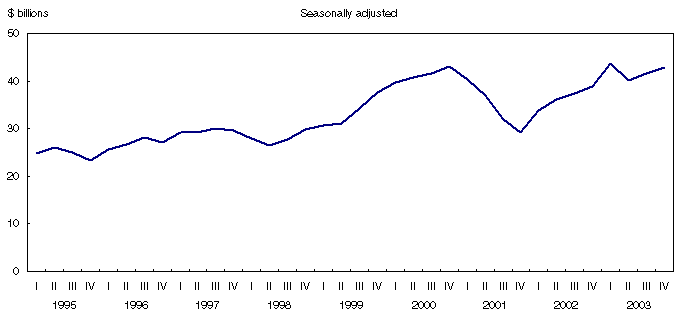
On a quarterly basis, fourth quarter profits rose 3.3% to $42.9 billion, following a similar advance in the third quarter. Profits have now risen for seven of the past eight quarters, following a downturn throughout the four quarters of 2001. The non-financial industries, led by transportation and mining, recorded a 2.5% profit increase, while gains by depository credit intermediaries contributed to fourth quarter growth of 5.5% in the financial sector. Chart 2

Profitable year for oil and gas producers Surging crude oil prices early in the year lifted operating profits of oil and gas producers to an all-time high of $20.4 billion in 2003, up 61.2% over 2002 levels. Supply concerns related to turmoil in Iraq and Venezuela pushed crude oil prices to previously unseen levels in the early months of 2003. However, prices retreated and profit growth was not sustained over the final three quarters of the year, as the marketplace adjusted to the more stable supply conditions. Export volumes of crude oil were up in 2003, but the stronger Canadian dollar trimmed returns on energy sales pegged in US dollars. Meanwhile, natural gas prices increased over 2002 levels, but were much less volatile than crude oil. Wholesale and retail profits both up in 2003 Wholesalers' operating profits jumped 28.0% to $13.3 billion in 2003 following a 12.6% gain in 2002. Operating revenue advanced 3.8% to $361.0 billion. Wholesalers of machinery and equipment lead the way, as their profits climbed 62.3% to $3.1 billion. Retailers reported $10.0 billion in profits in 2003, a 17.2% increase from 2002. Operating revenue swelled 6.7% to $332.2 billion, amid an environment of improved consumer confidence and low-cost financing. Profits of general merchandise stores (including department stores) rose 15.0%, on a 5.0% increase in operating revenue. On the other hand, profits of motor vehicle dealers were unchanged in 2003, as the incentive-driven sales momentum faltered. The December release of New Motor Vehicle Sales reported that the 2003 year ended with five consecutive monthly declines in new motor vehicle sales, pulling annual unit sales down 6.2% from record high levels in 2002. Setback year for manufacturers Many manufacturers faced a turbulent year in 2003. The outbreak of SARS in the Toronto area, the single case of mad cow disease (BSE) in Alberta, the August power blackout in Ontario and forest fires in British Columbia all influenced the manufacturing sector in one way or another. In addition, the war in Iraq, the ongoing Canada-US softwood lumber dispute and the stronger Canadian dollar, which closed the year at a 10 year high against its US counterpart, added to uncertainty for Canadian manufacturers during the year. Operating profits of manufacturers declined 9.2% to $34.9 billion in 2003, falling back to profit levels earned in 2001. Operating revenue was relatively unchanged (+0.2%) at $645.0 billion. Manufacturers of motor vehicles and parts saw their operating profits tumble to $3.0 billion in 2003 from $6.4 billion in 2002. Operating revenue fell 6.8%, as attractive incentives and low cost financing could not put the brakes on a deceleration in North American demand for motor vehicles. Exports of automotive products were down significantly for the year. Wood and paper producers’ operating profits fell 37.5% to $2.2 billion in 2003, the third consecutive annual profit slide. Annual profits peaked in 2000 at $7.8 billion. The prevailing duties on softwood lumber exports to the US, coupled with the effects of the stronger Canadian dollar, reduced returns for Canadian lumber exporters. Domestically, lumber demand from the construction sector was vigorous, and the value of building permits increased for an eighth consecutive year. However, average lumber prices were down in 2003 as supplies remained high. Pulp and paper producers struggled with sluggish North American markets and soft prices for most products. The primary metals industry saw operating profits tumble 40.5% to $1.4 billion in 2003. Soft commodity prices and waning demand, partly due to the slowdown in the automotive industry, contributed to the poor profit results for the year. The stronger Canadian dollar translated into lower returns on export sales, and manufacturers blamed low priced imports from foreign producers for keeping downward pressure on steel prices. The August electrical power blackout and ensuing conservation efforts further curbed results for some manufacturers operating in Ontario. The year ended on a more positive note, however, as demand and prices strengthened in the fourth quarter. Petroleum and coal manufacturers turned in stellar results for 2003, as prices for refined petroleum products soared early in the year. Operating profits climbed almost forty percent to a record $6.7 billion. Electronic and computer manufacturers showed signs of recovery in 2003, as operating profits rallied to $0.2 billion from losses of $1.5 billion in 2002. Operating revenue increased marginally, following two years of decline. Despite these positive signs, the industry remained in a prolonged downturn, with sluggish spending on telecommunications and electronic equipment. Several factors affected results in the accommodation and food services industry The outbreak of SARS in the Toronto area, the power blackout in Ontario, Hurricane Juan on the East coast and forest fires in British Columbia all played havoc with the accommodation and food services industry in 2003. In addition, the stronger Canadian dollar discouraged some US visitors from coming to Canada. Annual operating profits fell to $1.6 billion in 2003 from $2.1 billion in 2002. Chartered banks lifted financial sector profits The depository credit intermediaries enjoyed a banner year in 2003. Operating profits jumped 58.1% to $18.7 billion, as the chartered banks booked significantly lower loan loss provisions and earned higher net interest income for the year. Operating profits of insurance carriers climbed to $7.2 billion for 2003, up from $4.6 billion in 2002. Property and casualty insures registered the largest annual increase, with smaller gains reported by life insurers and reinsurance carriers. Quarterly profits up again Corporate profits climbed 3.3% in the fourth quarter of 2003, following a similar gain in the third quarter. Seven increases over the past eight quarters have lifted quarterly profits to $42.9 billion in the fourth quarter of 2003, just under the record high of $43.8 billion reported in the first quarter of 2003. The non-financial industries earned $31.8 billion in profits in the fourth quarter, up 2.5% from the third quarter. The financial industries saw their operating profits rise 5.5% to $11.1 billion in the quarter. Chart 3

Mixed results for resource sector Operating profits of mining companies (excluding oil and gas) increased to an eleven quarter high of $0.6 billion in the fourth quarter from $0.4 billion in the third quarter, as prices for most metals were up. Nickel prices were particularly strong, driven by tight supplies and increased demand from Asian and US markets. On the other hand, oil and gas producers saw their operating profits fall 9.8% to $4.1 billion in the fourth quarter. Profits had recently peaked at $7.2 billion in the first quarter of 2003, but fell back as crude oil prices retreated from their first quarter spike. Manufacturing profits recovered marginally Manufacturers earned $8.3 billion in profits in the fourth quarter, up 2.0% from the third quarter but well below the recent high of $10.1 billion earned in the first quarter of 2003. Manufacturers of electronics and computers earned $0.1 billion in the fourth quarter, an improvement from the $0.1 billion in losses recorded in the third quarter. Operating revenue was up 6.4% to $8.6 billion, a further indication that this beleaguered sector is showing signs of recovery. Wood and paper manufacturers reported $0.7 billion in fourth quarter operating profits, up 31.1% from the third quarter. Despite improvement over the past two quarters, profits remained a fraction of the $2.0 billion in average quarterly profits earned in 2000. Domestic demand for wood products was robust in the fourth quarter, with low interest rates and high consumer confidence fueling housing construction. However, export sales were hindered by the strong Canadian dollar and the duties on softwood lumber exports to the US continued to erode bottom line profits. Newsprint markets remained sluggish and paper prices faltered in the quarter. Primary metal producers halted four consecutive quarters of decline, as fourth quarter operating profits rebounded 38.7% to $0.3 billion. Operating revenue increased 2.3% from the third quarter, which had been adversely affected by the August power blackout over much of Ontario. Steel prices picked up in the quarter, as worldwide demand strengthened. On the down side, profits of petroleum and coal producers declined 12.4% to $1.3 billion in the fourth quarter, as crude and refined petroleum prices weakened. Companies cited the effects of the stronger Canadian dollar on export sales as a major factor in the lower fourth quarter profit results. For a third consecutive quarter, operating profits of motor vehicle and parts manufacturers slumped, falling 12.4% to $0.5 billion in the fourth quarter. The Monthly Survey of Manufacturing recently reported that shipments of motor vehicles declined in each of the final three quarters of 2003, as consumer appetite for new vehicles stalled. Despite an increase in the fourth quarter, the trend for operating revenue is downward, and fourth quarter 2003 revenue was well below year-earlier levels. Lower loan loss provisions lifted bank profits Depository credit intermediaries benefited from lower booked provisions for loan losses by chartered banks, as operating profits advanced 10.6% to $5.4 billion in the fourth quarter. Six consecutive quarterly increases have doubled profits since the third quarter of 2002. Other quarterly results Wholesale profits were up for a fourth straight quarter, rising 4.9% to $3.6 billion in the fourth quarter. Retailers were also better off, as their profits advanced 4.2% to $2.8 billion. Transportation carriers recouped some of the ground lost in the previous two quarters, as operating profits rose to $1.2 billion from $1.0 billion in the third quarter. Information and cultural industries saw profits slip to $2.1 billion from $2.3 billion in the third quarter, mainly due to lower profits of telecommunications companies. Profitability ratios The 2003 operating profit margin strengthened to 7.1% from 6.4% in 2002. Meanwhile, the return on average shareholders' equity gained over two percentage points to 9.8% in 2003 from 7.6% in 2002. The return on equity peaked at 10.9% in 2000. For the fourth quarter, the operating profit margin of corporations edged up to 7.2% from 7.0% in the third quarter. The return on shareholders' equity slipped to 9.4% from 9.5% in the previous quarter. Text table 1
|
||||||||||||||||||||||||||||||||||||||||||||||||||||||||||||||||||||||||||||||||||||||||||||||||||||||||||||||||||||||||||||||||||||||||||||||||||||||||||||||||||||||||||||||||||||||||||||||||||||||||||||||||||||||||||||||||||||||||||||||||||||||||||||||||||||||||||||||||||||||||||||||||||||||||||||||||||||||||||||||||||||||||||||||||||||
|
|
|