
Economic and Social Reports
Does taking short postsecondary programs or independent credits benefit recently displaced workers?
DOI: https://doi.org/10.25318/36280001202201100003-eng
Skip to text
Text begins
Abstract
Workers who experience a permanent layoff (a job loss not followed by rejoining the same firm in the current or subsequent year) are often affected financially for several years. Research has consistently shown that following a permanent layoff, earnings tend to decline sharply and remain below pre-layoff levels for several years. One approach to dealing with a permanent layoff is to reinvest in human capital by going back to school before returning to the labour market. Recent evidence suggests that only a small share of recently displaced workers enrol in postsecondary education, and among those who do, most tend to select short-term (i.e., non-degree), career-oriented programs or take a few credits that are not associated with a credential or program. This pattern may reflect the fact that many displaced workers may need to (and are able to) re-enter the workforce as soon as possible to pay bills and care for dependants.
The current study, based on the Longitudinal Worker File, the Postsecondary Student Information System, the 2006 Census of Population and the T1 Family File, examines the extent to which enrolling in, or graduating from, short, career-oriented programs or taking independent credits is associated with more favourable post-displacement earnings patterns.
The findings suggest that, compared with individuals who did not enrol in postsecondary education following a permanent layoff, individuals who graduated from a college or CEGEP certificate or diploma program after a job loss registered substantially larger percentage increases in annual earnings between one year before the layoff and five years after the layoff. The relative earnings increases were particularly large among individuals who graduated from short science, technology, engineering and mathematics (STEM) or health care programs. More moderate relative increases in earnings were registered by individuals who took independent credits. In contrast, graduates from a short non-STEM (except health care) program or a microcredential (a short program requiring only a small number of courses) after a job loss experienced no relative earnings gains. Graduates of microcredentials registered substantial earnings losses compared with individuals who did not enrol at all. Finally, displaced workers who enrolled in a short program from which they did not graduate experienced similar earnings trajectories as those who did not enrol at all.
Authors
Marc Frenette and Tomasz Handler are with the Social Analysis and Modelling Division, Analytical Studies and Modelling Branch, Statistics Canada.
Acknowledgment
The study was funded by Employment and Social Development Canada.
Introduction
A job loss may create a lot of financial uncertainty in the short and long term. Indeed, there is a very rich literature on the long-term earnings consequences associated with a permanent layoff (a job loss without returning to the same employer during the same or subsequent year). Several studies in Canada (Morissette et al. 2007; Chan et al. 2011; Bonikowska and Morissette 2012; Chan et al. 2020), the United States (Jacobson et al. 1993; Couch and Placzek 2010), the United Kingdom (Hijzen et al. 2010), Sweden (Eliason and Storrie 2006) and Finland (Huttunen et al. 2006) have all come to the same conclusion: many affected workers tend to experience reduced earnings because of the permanent layoff. The Canadian evidence points to high- and low-seniority workers experiencing persistent earnings losses following a permanent layoff.
Given the large and persistent earnings effects associated with a permanent layoff, it is important for affected workers and policy makers to be informed of the potential effectiveness of various coping strategies. Morissette and Qiu (2021) considered four possible options—enrolling in postsecondary education (university or college), signing up for registered apprenticeship training, moving to a different economic region or moving into unincorporated self-employment—and found that about 8 in 10 displaced workers adopted none of these approaches (roughly equivalent to the share of displaced workers who found a new job). Of those who did adopt a coping strategy, between 20% and 30% opted to enrol in postsecondary education. A key question then becomes: “Does this strategy work?”
Very little evidence exists to answer this question. In Canada, Frenette et al. (2011) found that enrolling in postsecondary education in the year following a job loss was associated with an almost $7,000 increase in annual earnings between the period spanning the five years preceding the job loss and nine years following it, compared with displaced workers who did not enrol in postsecondary education in the year following a job loss. Data limitations prevented the study from distinguishing individuals who graduated from the program in which they were enrolled from those who did not. Furthermore, program details were unavailable because enrolment status was derived from tax credits. An earlier U.S. study based out of Washington state did provide more details (Jacobson et al., 2005) on both fronts. Specifically, the authors used administrative data to show that the returns to a year of community college following job displacement were, on average, around 9% for men and 13% for women. Almost all the gains came from technical vocational and academic math and science courses. In contrast, the returns to non-technical courses were close to zero for both men and women.Note
Returning students can choose between several options once enrolled in postsecondary education. Aside from selecting a field of study, students can pursue a degree program (normally four years in duration), a diploma (normally two years) or a certificate program (normally one year). Shorter options are also available through microcredentials, foundational learning or high school upgrading. Some students may want to return to school to take one or more credits without obtaining a credential. For individuals compelled to enrol in postsecondary education because of a permanent layoff, time may be of critical importance. With ongoing bills and dependants in mind, affected workers may prefer short, career-oriented programs or independent credits, which can enable them to return to the labour market as quickly as possible. Recent evidence supports this preference. Handler and Frenette (2022) found that individuals who recently lost their job were more likely than their counterparts who did not lose their job to pursue microcredentials, certificates or diplomas but were less likely to enrol in independent credits (i.e., not associated with a credential).Note However, taking independent credits was by far the most common option among all adult learners whether it followed a layoff or not. Compared with their counterparts who were not displaced, men who lost their job were less likely to pursue an undergraduate degree, while women who lost their job were more likely to select science, technology, engineering and mathematics (STEM) programs.
Does the strategy of focusing on short (i.e., non-degree), career-oriented programs or independent credits after a permanent layoff benefit displaced workers? This is a difficult question to answer definitively, but the current study will inform the issue. Using administrative data that combine information on job loss (from the Longitudinal Worker File [LWF]) with details on the public postsecondary educational activities of affected workers (from the Postsecondary Student Information System [PSIS]) and that are complemented with census data on the personal characteristics of workers and income tax data from the T1 Family File (T1FF) on detailed earnings histories, this study serves as a follow-up to the work of Handler and Frenette (2022) by examining the association between various educational decisions made after experiencing a permanent layoff and post-layoff earnings trajectories up to five years after the layoff.
The remainder of this study includes a methods section that describes the data and quantitative approach, a results section, and a conclusion summarizing the results.
Methods
The main objective of this study is to estimate the association between specific postsecondary schooling activities following a permanent layoff and post-layoff earnings growth. To do this, the study uses linked data from the LWF, the PSIS and the 2006 Census of Population.
The LWF is a rich administrative dataset containing information collected from four sources: Records of Employment (ROEs), T4 slips, T1 tax files and the Longitudinal Employment Analysis Program (LEAP). ROEs provide information on job separations and their causes. When this information is combined with a unique business number from the LEAP, permanent layoffs can be identified. A layoff is identified in the ROE as a separation because of a shortage of work. A permanent layoff is a layoff that is not followed by rejoining the same firm in the current or subsequent year. The T4 Statements of Remuneration Paid include job-level information, such as the province of employment, annual employment earnings and union dues. The T1 tax file includes annual T4 earnings from all jobs, self-employment earnings, and full- and part-time postsecondary education deductions. The education credits help identify individuals who were enrolled in a postsecondary program within the tax year.Note The LEAP contains information on the industry, firm size and, because it is longitudinal, all the information required to derive job tenure (the number of tax years with the same employer).
Next, educational choices following the year of the potential layoff are captured by the PSIS, which is a large, individual-level dataset containing postsecondary education information on nearly all public postsecondary students in Canada. Comprehensive enrolment data are available in the PSIS from 2009 to 2018. Because a key feature of this paper is a more in-depth analysis of schooling activities than what has previously been attempted, it incorporates the program or credential type and field of study.
Finally, the 2006 Census of Population includes personal characteristics, such as year of birth, gender, population group (Black, White, Arab, etc.), immigrant status (including the year of arrival in Canada) and the highest level of education attained.Note
This study focuses on workers who were primarily engaged in paid employment, as opposed to being in school for several years before being permanently laid off. These workers may or may not have opted to enrol in a short postsecondary program or to take independent credits during the year of the layoff or the two years following the layoff before returning to the labour market. The key question asked is, “Following a permanent layoff, is taking a short program or independent credits associated with faster relative earnings growth than not returning to school?” A short program is any non-degree postsecondary program.
The analytical sample includes individuals aged 25 to 49Note years who were permanently laid off between 2010 and 2014Note (year T) from their main job held in year (T-1); had positive wages and salaries and no self-employment income in years (T-7), (T-4), (T-1) and T;Note had positive earnings in year (T+5);Note were not enrolled in postsecondary education at any point between years (T-7) and (T-1)Note and between years (T+3) and (T+5);Note appeared in the tax data in all years between (T-7) to (T+5), except possibly years (T+1) and (T+2);Note were permanent residents or Canadian citizens; and appeared in the 2006 Census.Note The final total sample size based on these criteria was 39,935 (25,722 men and 14,213 women).
The primary outcome of interest in this study is the relative growth in earnings between years (T-1) and (T+5), expressed in 2019 constant dollars. However, graphical analysis will show the entire earnings trajectory between years (T-7) and (T+5).
The main groups of interest in this study are determined by enrolment in a postsecondary program without graduation and graduation from a postsecondary program, all captured between years T and (T+2). Only certain types of enrolments without graduation are considered because of sample size limitations. These includeNote Note
- basic education and skills, high school diploma or general equivalency diploma (foundational learning or high school upgrading)
- non-credential, non-program enrolment (independent credits)Note
- attestation and other short program credentials (microcredential)
- career, technical or professional training certificate (college or CEGEPNote certificate)
- career, technical or professional training diploma (college or CEGEP diploma)
- other type of postsecondary credential, not elsewhere classified (other credential, excluding degree or undergraduate certificate or diploma).
The list of graduations that the study can examine is even shorter (again, because of sample size limitations). These graduations include
- attestation and other short program credentials (microcredential)
- career, technical or professional training certificate (college or CEGEP certificate)
- career, technical or professional training diploma (college or CEGEP diploma).
Any enrolments without graduation or graduations not covered by the above lists were excluded from the sample.Note Individuals who opted not to enrol in a postsecondary program following a permanent layoff are included as a comparison group.Note Note
Enrolments in postsecondary education with and without graduation are disaggregated by the following broad fields of study when they are available:Note Note
- STEM and health care
- physical and chemical sciences, engineering, engineering technology, mathematics and related studies, and computer and information sciences
- biological sciences and general and integrated sciences
- health care (medicine, dentistry, optometry and veterinary medicine, nursing, pharmacy and related programs, and health care not elsewhere classified)
- non-STEM (except health care)
- all non-STEM programs except health care.
The quantitative analysis uses ordinary least squares models in a difference-in-differences framework to estimate the relationship between the main outcome variable—the difference in the natural logarithm of earnings in year (T+5) minus year (T-1)—and various indicators of post-layoff educational pathways (the key independent variables), personal and job characteristics, and pre-layoff earnings trends serving as covariates. The model is a difference-in-differences estimator because the difference in log earnings growth will be compared for the various groups of permanently displaced workers based on their post-layoff educational pathways. The covariates in the model include indicators for gender and age,Note highest level of educational attainment, immigrant status, population group (e.g., White, Chinese, South Asian), province or territory of residence, job tenure, union status, firm size, industry, year of the permanent layoff, log earnings growth between years (T-7) and (T-4) to account for pre-existing trends in earnings that were in place well before the layoff, log earnings growth between years (T-4) and (T-1) to account for differences in pre-layoff declines in earnings, and level of earnings in year (T-7).Note Note
Results
Chart 1 shows the earnings trajectories (expressed in 2019 constant dollars) of three groups of men who were permanently laid off from their main job between 2010 and 2014 (year T), based on their educational choices shortly following the layoff (years T to [T+2]): those who did not enrol, those who enrolled without graduating and those who graduated. As noted in the Methods section, only short courses and independent credits with sufficient sample sizes were considered in the analysis.
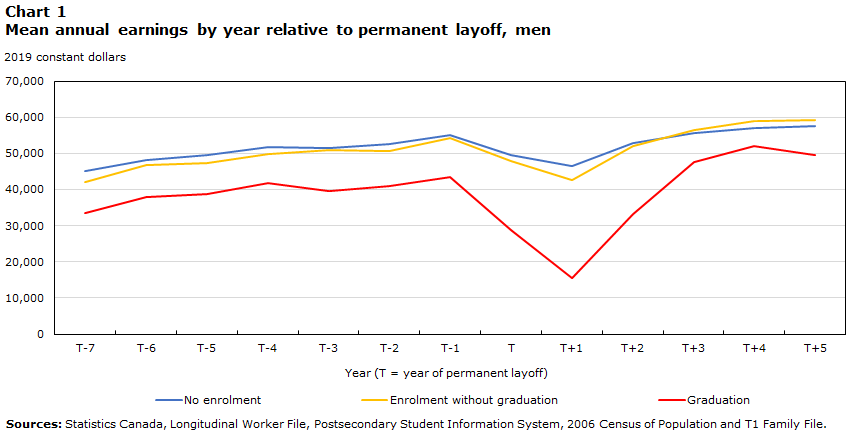
Data table for Chart 1
| Year (T = year of permanent layoff) | No enrolment | Enrolment without graduation | Graduation |
|---|---|---|---|
| 2019 constant dollars | |||
| T-7 | 45,093.27 | 42,053.75 | 33,499.71 |
| T-6 | 48,014.35 | 46,846.54 | 38,010.30 |
| T-5 | 49,493.16 | 47,416.82 | 38,640.68 |
| T-4 | 51,852.88 | 49,714.90 | 41,769.24 |
| T-3 | 51,415.98 | 50,874.11 | 39,535.94 |
| T-2 | 52,542.14 | 50,599.27 | 41,097.29 |
| T-1 | 55,163.26 | 54,358.81 | 43,419.34 |
| T | 49,399.75 | 47,784.91 | 28,753.55 |
| T+1 | 46,471.55 | 42,685.93 | 15,540.35 |
| T+2 | 52,927.50 | 52,118.76 | 33,119.00 |
| T+3 | 55,540.78 | 56,359.34 | 47,621.98 |
| T+4 | 57,010.80 | 59,002.05 | 52,137.60 |
| T+5 | 57,663.40 | 59,134.94 | 49,485.06 |
| Sources: Statistics Canada, Longitudinal Worker File, Postsecondary Student Information System, 2006 Census of Population and T1 Family File. | |||
Beginning with the men who chose not to return to school after their permanent layoff, mean annual earnings rose slowly but steadily in the years preceding their layoff. Earnings fell in year T, when they were laid off, and further still in the following year (T+1) as they were presumably still regaining their footing in the labour market. Earnings started to rebound thereafter, inching slowly upward in the following years. By the end of the period, annual earnings had fully recovered to their pre-layoff level. Earnings stood at $57,663 in year (T+5), compared with $55,163 in year (T-1)—an increase of $2,500.
For the men who chose to return to school after their layoff, but did not graduate from a program, their mean earnings trajectories were almost identical to non-enrollees, except the decline in earnings was somewhat larger, but so was the recovery. By year (T+5), their earnings reached $59,135, well above $54,359 in year (T-1)—an increase of $4,776. More importantly, their small investment in retraining, even without obtaining a credential, represented just over $2,000 in additional earnings growth compared with men who did not return to school.
The earnings pathway for men who returned to school and graduated from a short program was very different than that of their two counterparts. First, mean pre-layoff earnings were substantially lower—$43,419 in year (T-1), at least $10,000 less than the other two groups. Although pre-layoff earnings grew almost as fast as for the other two groups, the decline in earnings experienced by future graduates shortly after their permanent layoff was substantially greater. This might be because this group made the biggest educational commitment to their studies following the layoff, possibly at the expense of their labour supply. Alternatively, the large drop in earnings may have prompted them to reinvest in their human capital. Whatever the case, earnings started to recover in year (T+2) and reached $49,485 by year (T+5)—$6,066 more than in year (T-1). This post-layoff earnings growth was slightly greater than what was registered by individuals who enrolled in a program from which they did not graduate (a difference of $1,290).
The same general trends held for women who faced a permanent layoff during the same period (Chart 2). Similar to men, the mean annual earnings for displaced women who graduated from a short program were $6,892 greater in year (T+5) than in year (T-1). Their counterparts who enrolled in a program from which they did not graduate registered a smaller increase in earnings over the same period ($4,092). This was greater than the increase registered by non-enrollees ($2,347).
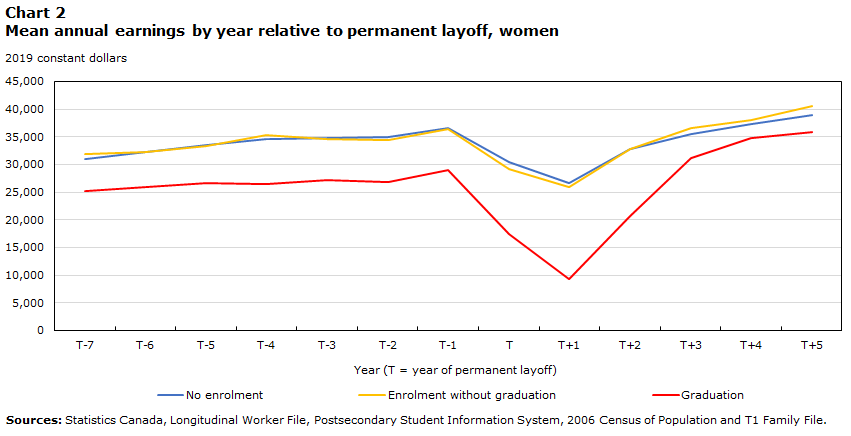
Data table for Chart 2
| Year (T = year of permanent layoff) | No enrolment | Enrolment without graduation | Graduation |
|---|---|---|---|
| 2019 constant dollars | |||
| T-7 | 30,953.50 | 31,792.75 | 25,210.11 |
| T-6 | 32,322.29 | 32,271.46 | 25,879.92 |
| T-5 | 33,518.60 | 33,353.63 | 26,563.60 |
| T-4 | 34,580.66 | 35,341.58 | 26,530.43 |
| T-3 | 34,707.09 | 34,625.48 | 27,162.27 |
| T-2 | 34,921.03 | 34,490.59 | 26,901.84 |
| T-1 | 36,588.17 | 36,396.96 | 28,961.09 |
| T | 30,510.96 | 29,202.90 | 17,367.40 |
| T+1 | 26,622.54 | 25,898.30 | 9,219.55 |
| T+2 | 32,763.91 | 32,759.55 | 20,683.36 |
| T+3 | 35,508.62 | 36,596.17 | 31,060.46 |
| T+4 | 37,320.52 | 38,007.74 | 34,742.02 |
| T+5 | 38,934.99 | 40,488.84 | 35,853.18 |
| Sources: Statistics Canada, Longitudinal Worker File, Postsecondary Student Information System, 2006 Census of Population and T1 Family File. | |||
Given the similarity in the results for men and women and given that the more detailed analysis to follow does not allow for a gender breakdown (because of the low sample sizes in some educational categories), the remainder of this study will not be disaggregated by gender. The analysis conducted thus far is summarized in Chart 3. Specifically, mean annual earnings for displaced workers who graduated from a short program were $6,530 greater in year (T+5) than in year (T-1). This was somewhat greater than for those who returned to school but did not graduate ($4,513) and greater still than for those who did not enrol at all ($2,447).
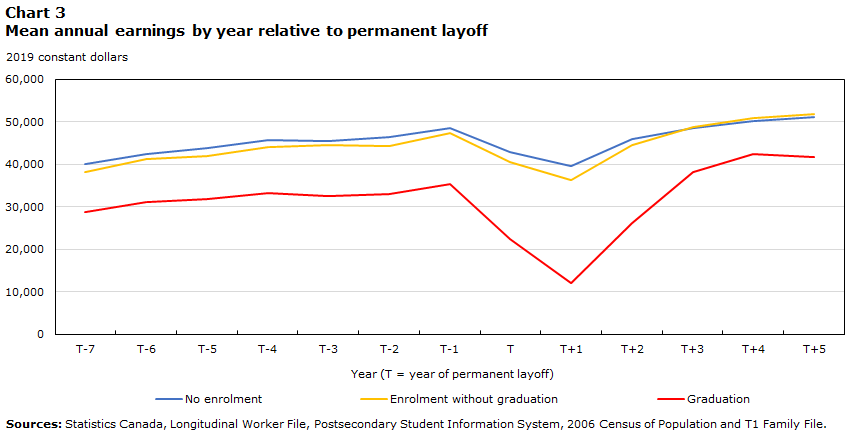
Data table for Chart 3
| Year (T = year of permanent layoff) | No enrolment | Enrolment without graduation | Graduation |
|---|---|---|---|
| 2019 constant dollars | |||
| T-7 | 40,157.28 | 38,111.55 | 28,840.53 |
| T-6 | 42,536.47 | 41,246.90 | 31,192.40 |
| T-5 | 43,916.67 | 42,013.85 | 31,852.74 |
| T-4 | 45,823.39 | 44,192.78 | 33,204.24 |
| T-3 | 45,583.14 | 44,631.51 | 32,581.30 |
| T-2 | 46,390.86 | 44,410.44 | 33,118.72 |
| T-1 | 48,678.96 | 47,458.00 | 35,293.06 |
| T | 42,805.94 | 40,645.84 | 22,353.94 |
| T+1 | 39,542.55 | 36,236.25 | 11,987.74 |
| T+2 | 45,888.68 | 44,681.09 | 26,129.53 |
| T+3 | 48,547.83 | 48,766.48 | 38,313.55 |
| T+4 | 50,137.20 | 50,936.19 | 42,360.39 |
| T+5 | 51,125.58 | 51,971.25 | 41,823.24 |
| Sources: Statistics Canada, Longitudinal Worker File, Postsecondary Student Information System, 2006 Census of Population and T1 Family File. | |||
On the surface, displaced workers who graduated from a short program following a layoff only somewhat improved their pre-layoff earnings position relative to their counterparts who did not enrol or who enrolled but did not graduate. However, no consideration has been given to the specific type of credential or credits pursued. In Chart 4, mean earnings trajectories are displayed by specific type of enrolment without graduation, with individuals in the no enrolment category once again serving as the comparison group. Individuals who pursued a short program or independent credits often fared about as well as or better than those who did not choose to enrol at all. The exception is the group who enrolled in (but did not graduate from) a foundational learning or high school upgrading program. In this group, mean earnings fell by $5,202 between years (T-1) and (T+5), compared with the $2,447 increase registered by the group that did not enrol. More than two-thirds of displaced individuals who enrolled in a program from which they did not graduate took independent credits. Their mean earnings increased by $5,305 from one year before their permanent layoff to five years afterwards.
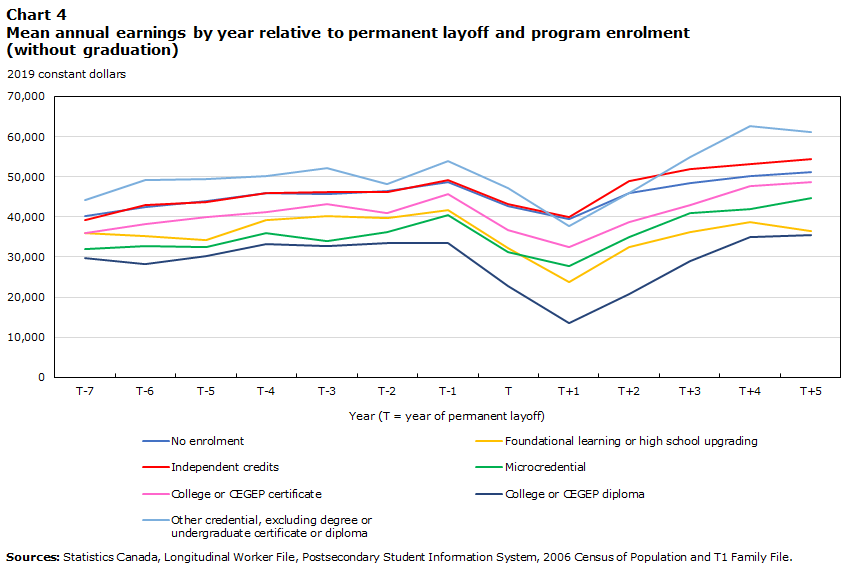
Data table for Chart 4
| Year (T = year of permanent layoff) | No enrolment | Foundational learning or high school upgrading | Independent credits | Microcredential | College or CEGEP certificate | College or CEGEP diploma | Other credential, excluding degree or undergraduate certificate or diploma |
|---|---|---|---|---|---|---|---|
| 2019 constant dollars | |||||||
| T-7 | 40,157.28 | 35,893.91 | 39,129.72 | 32,096.27 | 35,844.02 | 29,770.75 | 44,127.87 |
| T-6 | 42,536.47 | 35,098.41 | 43,006.92 | 32,734.86 | 38,324.74 | 28,289.05 | 49,181.98 |
| T-5 | 43,916.67 | 34,147.23 | 43,786.27 | 32,580.77 | 39,880.70 | 30,117.74 | 49,504.48 |
| T-4 | 45,823.39 | 39,247.21 | 45,841.20 | 36,066.62 | 41,172.76 | 33,153.86 | 50,158.85 |
| T-3 | 45,583.14 | 40,239.67 | 46,198.77 | 33,888.82 | 43,132.48 | 32,615.92 | 52,237.21 |
| T-2 | 46,390.86 | 39,590.93 | 46,280.07 | 36,201.99 | 40,861.06 | 33,379.35 | 48,286.08 |
| T-1 | 48,678.96 | 41,711.16 | 49,202.22 | 40,371.33 | 45,797.58 | 33,513.17 | 53,949.88 |
| T | 42,805.94 | 32,261.21 | 43,294.08 | 31,153.18 | 36,809.39 | 22,657.00 | 47,220.61 |
| T+1 | 39,542.55 | 23,793.66 | 39,953.13 | 27,690.77 | 32,546.68 | 13,590.03 | 37,602.46 |
| T+2 | 45,888.68 | 32,413.36 | 48,823.18 | 35,003.69 | 38,597.72 | 20,736.59 | 45,968.05 |
| T+3 | 48,547.83 | 36,133.19 | 52,019.69 | 40,827.32 | 42,858.77 | 28,922.80 | 54,879.23 |
| T+4 | 50,137.20 | 38,592.29 | 53,106.10 | 42,033.36 | 47,800.17 | 34,900.48 | 62,752.74 |
| T+5 | 51,125.58 | 36,509.60 | 54,507.33 | 44,697.84 | 48,760.84 | 35,580.48 | 61,111.75 |
| Sources: Statistics Canada, Longitudinal Worker File, Postsecondary Student Information System, 2006 Census of Population and T1 Family File. | |||||||
The focus now shifts to individuals who graduated from a short program shortly after experiencing a permanent layoff (Chart 5). An increase in mean earnings over the (T-1) to (T+5) period was registered for individuals who graduated from a microcredential ($1,283), but this was smaller than the increase registered by those who did not enrol ($2,447). In contrast, individuals who obtained a college or CEGEP certificate ($7,264) or diploma ($9,587) registered much larger post-layoff increases in earnings.
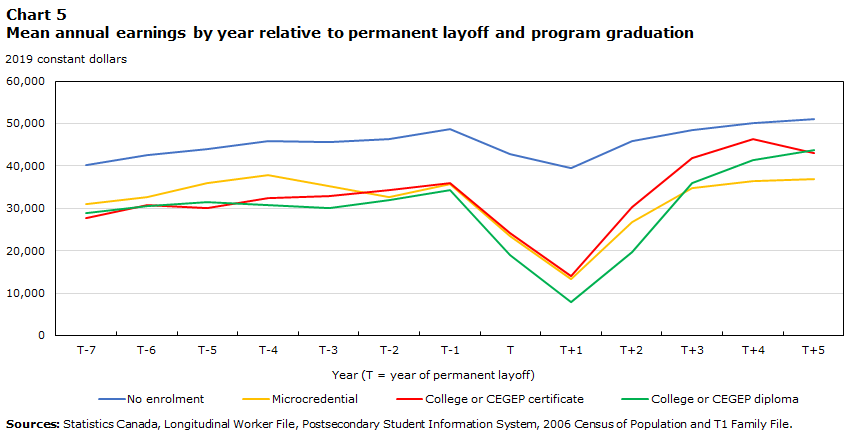
Data table for Chart 5
| Year (T = year of permanent layoff) | No enrolment | Microcredential | College or CEGEP certificate | College or CEGEP diploma |
|---|---|---|---|---|
| 2019 constant dollars | ||||
| T-7 | 40,157.28 | 30,901.72 | 27,702.47 | 28,883.47 |
| T-6 | 42,536.47 | 32,685.89 | 30,768.43 | 30,637.29 |
| T-5 | 43,916.67 | 35,875.78 | 29,995.84 | 31,403.37 |
| T-4 | 45,823.39 | 37,741.69 | 32,410.64 | 30,794.21 |
| T-3 | 45,583.14 | 35,188.12 | 32,832.34 | 30,162.26 |
| T-2 | 46,390.86 | 32,536.43 | 34,306.07 | 31,839.68 |
| T-1 | 48,678.96 | 35,648.15 | 35,839.11 | 34,214.60 |
| T | 42,805.94 | 23,386.34 | 24,102.90 | 18,982.32 |
| T+1 | 39,542.55 | 13,372.06 | 14,081.74 | 7,834.26 |
| T+2 | 45,888.68 | 26,709.50 | 30,215.06 | 19,695.14 |
| T+3 | 48,547.83 | 34,881.21 | 41,738.76 | 36,003.24 |
| T+4 | 50,137.20 | 36,404.61 | 46,258.13 | 41,344.75 |
| T+5 | 51,125.58 | 36,930.95 | 43,103.03 | 43,801.16 |
| Sources: Statistics Canada, Longitudinal Worker File, Postsecondary Student Information System, 2006 Census of Population and T1 Family File. | ||||
What one studies while in school may also matter. The earnings patterns among those who enrolled in a program without graduating are shown in Chart 6. Perhaps surprisingly, individuals who took a STEM or health care program saw their mean earnings decline slightly (by $495) between year (T-1) and year (T+5). Individuals who took a non-STEM (except health care) program or had no field at all fared somewhat better, with increases of almost $5,000. However, these results strictly pertain to those who did not graduate.
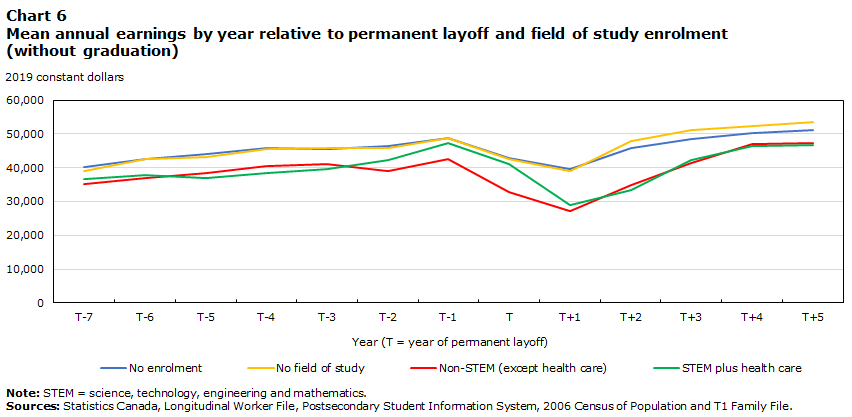
Data table for Chart 6
| Year (T = year of permanent layoff) | No enrolment | No field of study | Non-STEM (except health care) | STEM plus health care |
|---|---|---|---|---|
| 2019 constant dollars | ||||
| T-7 | 40,157.28 | 38,939.80 | 35,252.15 | 36,525.64 |
| T-6 | 42,536.47 | 42,542.74 | 36,961.70 | 37,949.87 |
| T-5 | 43,916.67 | 43,220.51 | 38,492.16 | 36,915.34 |
| T-4 | 45,823.39 | 45,454.17 | 40,628.61 | 38,355.53 |
| T-3 | 45,583.14 | 45,849.01 | 41,049.50 | 39,611.40 |
| T-2 | 46,390.86 | 45,887.45 | 39,151.13 | 42,275.35 |
| T-1 | 48,678.96 | 48,762.53 | 42,434.51 | 47,209.74 |
| T | 42,805.94 | 42,646.51 | 32,770.86 | 41,004.35 |
| T+1 | 39,542.55 | 39,004.66 | 27,155.39 | 28,872.03 |
| T+2 | 45,888.68 | 47,860.02 | 34,881.23 | 33,508.79 |
| T+3 | 48,547.83 | 51,087.24 | 41,253.75 | 42,161.28 |
| T+4 | 50,137.20 | 52,254.22 | 46,876.37 | 46,289.48 |
| T+5 | 51,125.58 | 53,450.96 | 47,422.73 | 46,714.15 |
|
Note: STEM = science, technology, engineering and mathematics. Sources: Statistics Canada, Longitudinal Worker File, Postsecondary Student Information System, 2006 Census of Population and T1 Family File. |
||||
The story is very different among graduates (Chart 7). First, as was the case for enrollees who did not graduate, all groups of graduates fared better than non-enrollees, regardless of their field of study. However, what they studied mattered significantly. Specifically, individuals who graduated from a short STEM or health care program earned $11,606 more, on average, in year (T+5) than in year (T-1). Earnings trajectories were far less favourable for graduates of a non-STEM (except health care) program, although they still fared somewhat better than non-enrollees, with an average increase of $3,031.

Data table for Chart 7
| Year (T = year of permanent layoff) | No enrolment | Non-STEM (except health care) | STEM plus health care |
|---|---|---|---|
| 2019 constant dollars | |||
| T-7 | 40,157.28 | 28,959.16 | 28,668.44 |
| T-6 | 42,536.47 | 30,372.60 | 32,381.67 |
| T-5 | 43,916.67 | 30,993.91 | 33,098.61 |
| T-4 | 45,823.39 | 31,831.42 | 35,195.76 |
| T-3 | 45,583.14 | 31,671.88 | 33,900.57 |
| T-2 | 46,390.86 | 32,545.25 | 33,950.63 |
| T-1 | 48,678.96 | 34,769.73 | 36,052.23 |
| T | 42,805.94 | 21,847.73 | 23,088.30 |
| T+1 | 39,542.55 | 11,170.49 | 13,173.30 |
| T+2 | 45,888.68 | 22,040.93 | 32,060.75 |
| T+3 | 48,547.83 | 33,476.49 | 45,330.54 |
| T+4 | 50,137.20 | 37,252.64 | 49,770.05 |
| T+5 | 51,125.58 | 37,801.01 | 47,658.18 |
|
Note: STEM = science, technology, engineering and mathematics. Sources: Statistics Canada, Longitudinal Worker File, Postsecondary Student Information System, 2006 Census of Population and T1 Family File. |
|||
The post-layoff earnings growth comparisons presented in the above seven charts do not account for differences in earnings determinants that may exist between the different groups of displaced workers. It is very common in the post-displacement earnings literature to account for pre-layoff earnings trends, as these may also determine post-layoff earnings trends. Importantly, earnings may begin to decline before the layoff as firms struggle financially and cut employee hours. Between years (T-7) and (T-4)—well before the layoff in year T—the mean log growth in earnings was higher for individuals who returned to school (0.182 for those who graduated and 0.197 for those who did not) compared with individuals who did not enrol (0.142). Firms that struggle financially might be selective in how they allocate cuts in work hours across employees. However, mean log growth in earnings between years (T-4) and (T-1) was about the same for all three groups (roughly 0.100). Another factor to consider is the level of earnings at the beginning of the study period (year [T-7]). This may also be correlated with an employee’s earnings potential in some way that is not captured by observable personal and job characteristics. Individuals who graduated from a short program after being laid off earned $28,841, on average, in year (T-7). This is well below what individuals who enrolled in a program from which they did not graduate ($38,112) and individuals who did not enrol in a program ($40,157) earned.
These differences in pre-layoff earnings levels and growth rates, along with the differences in several other pre-layoff personal and job characteristics that could potentially impact post-layoff earnings growth (shown in Table 1), will be taken into account in the econometric models that follow. The difference-in-differences models also account for unobserved differences that could affect the levels of earnings.
To summarize Table 1, displaced workers who graduated from a program (in comparison with other displaced employees) were more likely to be female and younger, far less likely to have no educational credentials, far more likely to have a high school diploma or equivalent, less likely to live in Ontario and Alberta, more likely to live in the Atlantic provinces, more likely to have worked in a very large firm (with 500 or more employees), far less likely to have been employed in construction, far more likely to be employed in retail trade and accommodation and food services, and less likely to have been laid off in 2013 or 2014 (but more likely to have been laid off in 2012). The other examined characteristics were similar across the three groups.
| No enrolment | Enrolment without graduation | Graduation | |
|---|---|---|---|
| percent | |||
| Female | 34.9 | 38.4 | 56.2 |
| Age | |||
| 25 to 34 years old | 31.5 | 37.1 | 44.5 |
| 35 to 44 years old | 41.2 | 39.5 | 40.5 |
| 45 to 49 years old | 27.3 | 23.5 | 15.0 |
| Highest level of educational attainment | |||
| None | 20.3 | 16.8 | 9.6 |
| High school graduation certificate or equivalency certificate | 29.9 | 32.3 | 40.6 |
| Other trades certificate or diploma | 11.6 | 8.2 | 5.2 |
| Registered apprenticeship certificate | 6.2 | 6.7 | 4.6 |
| College, CEGEP or other non-university certificate or diploma from a program of three months to less than one year | 2.5 | 3.4 | 8.0 |
| College, CEGEP or other non-university certificate or diploma from a program of one to two years | 9.6 | 10.7 | 15.9 |
| College, CEGEP or other non-university certificate or diploma from a program of more than two years | 6.7 | 7.6 | 7.7 |
| University certificate or diploma below bachelor level | 2.5 | 3.5 | 2.0 |
| Bachelor's degree | 8.1 | 8.1 | 4.7 |
| University certificate or diploma above bachelor level | 0.8 | 1.1 | 0.3 |
| Graduate or professional degree | 1.8 | 1.8 | 1.4 |
| Immigrant status | |||
| Canadian born | 82.9 | 85.3 | 87.2 |
| Landed 10 years ago or less | 3.1 | 3.0 | 2.9 |
| Landed more than 10 years ago | 14.0 | 11.7 | 9.9 |
| Province or territory | |||
| Newfoundland and Labrador | 2.4 | 6.0 | 3.3 |
| Prince Edward Island | 0.6 | 1.3 | 1.7 |
| Nova Scotia | 3.7 | 4.6 | 7.9 |
| New Brunswick | 3.6 | 3.8 | 10.6 |
| Quebec | 28.0 | 6.5 | 18.6 |
| Ontario | 35.5 | 37.8 | 29.3 |
| Manitoba | 2.4 | 2.2 | 2.6 |
| Saskatchewan | 1.8 | 3.2 | 2.2 |
| Alberta | 11.6 | 9.5 | 6.9 |
| British Columbia | 10.0 | 22.5 | 16.6 |
| Yukon | 0.1 | 1.2 | 0.0 |
| Northwest Territories | 0.2 | 0.7 | 0.2 |
| Nunavut | 0.2 | 0.6 | 0.0 |
| Job tenure | |||
| 1 year | 27.6 | 30.0 | 27.5 |
| 2 years | 14.7 | 15.5 | 10.7 |
| 3 years | 10.3 | 10.9 | 11.5 |
| 4 years | 7.9 | 7.0 | 5.2 |
| 5 years | 6.6 | 5.8 | 5.3 |
| 6 years | 5.8 | 5.4 | 4.8 |
| 7 years or more | 27.0 | 25.3 | 34.9 |
| Union status indicator | 18.2 | 15.2 | 15.5 |
| Firm size | |||
| Fewer than 20 employees | 31.9 | 29.3 | 31.1 |
| 20 to fewer than 100 employees | 23.7 | 24.7 | 20.6 |
| 100 to fewer than 500 employees | 15.2 | 12.9 | 12.3 |
| 500 employees or more | 29.2 | 33.1 | 36.0 |
| Industry | |||
| Mining, quarrying, and oil and gas extraction | 2.5 | 2.6 | 0.6 |
| Construction | 21.3 | 22.6 | 9.7 |
| Manufacturing | 15.1 | 12.6 | 14.9 |
| Retail trade and accommodation and food services | 14.2 | 11.9 | 25.2 |
| Transportation and warehousing; information and cultural industries; finance and insurance; real estate and rental and leasing; professional, scientific and technical services; and administrative and support, waste management and remediation services | 25.5 | 23.2 | 24.6 |
| Educational services, health care and social assistance, and public administration | 6.7 | 9.7 | 10.1 |
| Agriculture, forestry, fishing and hunting; utilities; wholesale trade; arts, entertainment and recreation; and other services (except public administration) | 13.8 | 15.9 | 14.8 |
| Unknown | 0.9 | 1.5 | 0.2 |
| Year of the permanent layoff | |||
| 2010 | 20.3 | 21.0 | 19.6 |
| 2011 | 19.5 | 19.7 | 20.2 |
| 2012 | 20.0 | 20.1 | 27.4 |
| 2013 | 20.1 | 20.6 | 14.8 |
| 2014 | 20.1 | 18.7 | 18.0 |
|
Notes: A series of population group indicator variables (e.g. White, Chinese, South Asian, etc.) was also examined and the distributions were fairly similar across post-layoff educational categories. All variables are measured in the year prior to the permanent layoff, except the highest level of educational attainment and the population group (both measured with the 2006 Census), as well as the year of the permanent layoff. Sources: Statistics Canada, Longitudinal Worker File, Postsecondary Student Information System, 2006 Census of Population and T1 Family File. |
|||
Table 2 displays the results of regressing the difference in the natural logarithm of post-layoff earnings in years (T+5) and (T-1) on various indicators of post-layoff educational activities and credentials obtained in models with and without covariates. Coefficients from this model, along with their implied percentage effect to focus on relative post-layoff earnings associations, are shown.Note Beginning with the most parsimonious categorization without covariates, displaced individuals who graduated from a short program registered 11.4% more post-layoff earnings growth than displaced workers who did not return to school. Individuals who enrolled in a program from which they did not graduate registered 3.9% more in post-layoff earnings growth than non-enrollees, but the coefficient associated with this result was not statistically significant at 10%.Note
After all the personal and job characteristics described in Table 1 are accounted for, there is no evidence that, in the aggregate, individuals who returned to school enjoyed more relative earnings growth than those who did not. This was also true in subsequent models, which incrementally accounted for the growth in log earnings between years (T-7) and (T-4), the growth in log earnings between years (T-4) and (T-1), and the level of earnings in year (T-7).
Because of sample size limitations and the impossibility of graduating from a program by taking independent credits alone, the two broad groups who returned to school cannot be directly compared without more detailed analysis. After the two groups are further dissected, the type of enrolment or graduation still mattered significantly in these results, even after accounting for differences in personal and job characteristics and pre-layoff earnings trends and levels. For example, among individuals who enrolled in but did not graduate from a program, two groups registered significantly different relative earnings growth compared with those who did not enrol at all: individuals who took foundational learning or high school upgrading (22.3% lower growth)Note and individuals who took independent credits (7.0% higher growth). All other results for those who enrolled in a program from which they did not graduate are not statistically significant (possibly because of low sample sizes).
The results were much clearer for displaced workers who graduated from a program. Specifically, individuals who graduated from a college or CEGEP certificate program registered 14.2% more in post-layoff earnings growth than non-enrollees. For those who graduated from a college or CEGEP diploma program, their post-layoff earnings growth was 21.8% greater than that for non-enrollees. In contrast, individuals who graduated from a microcredential registered significantly lower post-layoff earnings growth (-25.3%) compared with non-enrollees.
Results did not vary by field of study among individuals who enrolled in a program from which they did not graduate. They did, however, vary considerably by field of study among graduates. As shown in Chart 7, individuals who graduated from a STEM or health care program registered, by far, the largest earnings growth in the post-layoff period. This is still true after accounting for personal and job characteristics and pre-layoff earnings trends and levels. Specifically, individuals who graduated from a short STEM or health care program experienced 28.1% higher post-layoff earnings growth than those who did not enrol at all. No significant differences in post-layoff earnings growth were evident between individuals who graduated from a non-STEM (except health care) program and individuals who did not enrol at all.
| No covariates | Personal and job characteristics added | Growth in log earnings between years (T-7) and (T-4) added | Growth in log earnings between years (T-4) and (T-1) added | Level of earnings in year (T-7) added | |||||||||||
|---|---|---|---|---|---|---|---|---|---|---|---|---|---|---|---|
| Coefficient | Standard error | Percentage effect | Coefficient | Standard error | Percentage effect | Coefficient | Standard error | Percentage effect | Coefficient | Standard error | Percentage effect | Coefficient | Standard error | Percentage effect | |
| Overall (reference group = no enrolment) | |||||||||||||||
| Enrolment without graduation | 0.038 | 0.031 | 3.9 | 0.026 | 0.030 | 2.7 | 0.028 | 0.030 | 2.8 | 0.029 | 0.027 | 3.0 | 0.021 | 0.027 | 2.2 |
| Graduation | 0.108Note * | 0.052 | 11.4 | 0.053 | 0.052 | 5.5 | 0.054 | 0.052 | 5.5 | 0.065 | 0.057 | 6.7 | 0.050 | 0.056 | 5.1 |
| By program (reference group = no enrolment) | |||||||||||||||
| Enrolment without graduation | |||||||||||||||
| Foundational learning or high school upgrading | -0.295Table 2 Note † | 0.176 | -25.6 | -0.290Table 2 Note † | 0.172 | -25.2 | -0.291Table 2 Note † | 0.171 | -25.2 | -0.257Table 2 Note † | 0.148 | -22.7 | -0.253Table 2 Note † | 0.149 | -22.3 |
| Independent credits | 0.079Note * | 0.035 | 8.3 | 0.072Note * | 0.034 | 7.5 | 0.074Note * | 0.034 | 7.7 | 0.075Note * | 0.030 | 7.8 | 0.068Note * | 0.030 | 7.0 |
| Microcredential | -0.001 | 0.146 | -0.1 | -0.053 | 0.152 | -5.2 | -0.055 | 0.153 | -5.4 | 0.029 | 0.126 | 3.0 | 0.017 | 0.124 | 1.7 |
| College or CEGEP certificate | 0.008 | 0.107 | 0.8 | 0.002 | 0.103 | 0.2 | 0.001 | 0.103 | 0.1 | 0.028 | 0.109 | 2.9 | 0.021 | 0.109 | 2.1 |
| College or CEGEP diploma | 0.008 | 0.135 | 0.8 | -0.054 | 0.131 | -5.3 | -0.058 | 0.132 | -5.6 | -0.117 | 0.112 | -11.0 | -0.150 | 0.112 | -13.9 |
| Other credential, excluding degree or undergraduate certificate or diploma | -0.111 | 0.156 | -10.5 | -0.100 | 0.153 | -9.5 | -0.101 | 0.155 | -9.6 | -0.127 | 0.142 | -11.9 | -0.117 | 0.141 | -11.1 |
| Graduation | |||||||||||||||
| Microcredential | -0.136 | 0.114 | -12.7 | -0.193 | 0.123 | -17.5 | -0.190 | 0.124 | -17.3 | -0.274Table 2 Note † | 0.156 | -24.0 | -0.292Table 2 Note † | 0.157 | -25.3 |
| College or CEGEP certificate | 0.161Note * | 0.079 | 17.5 | 0.132Table 2 Note † | 0.075 | 14.1 | 0.131Table 2 Note † | 0.075 | 14.0 | 0.154Note * | 0.071 | 16.6 | 0.133Table 2 Note † | 0.070 | 14.2 |
| College or CEGEP diploma | 0.221Note ** | 0.074 | 24.7 | 0.133Table 2 Note † | 0.072 | 14.2 | 0.133Table 2 Note † | 0.072 | 14.2 | 0.203Note ** | 0.070 | 22.5 | 0.197Note ** | 0.067 | 21.8 |
| By field of study (reference group = no enrolment) | |||||||||||||||
| Enrolment without graduation | |||||||||||||||
| No field of study | 0.057Table 2 Note † | 0.034 | 5.9 | 0.050 | 0.034 | 5.2 | 0.052 | 0.034 | 5.4 | 0.055Table 2 Note † | 0.030 | 5.6 | 0.048 | 0.030 | 4.9 |
| Non-STEM (except health care) | 0.017 | 0.075 | 1.7 | -0.013 | 0.073 | -1.3 | -0.014 | 0.073 | -1.4 | -0.024 | 0.067 | -2.4 | -0.036 | 0.067 | -3.5 |
| STEM plus health care | -0.194 | 0.162 | -17.6 | -0.202 | 0.167 | -18.3 | -0.206 | 0.167 | -18.6 | -0.171 | 0.157 | -15.7 | -0.181 | 0.153 | -16.5 |
| Graduation | |||||||||||||||
| Non-STEM (except health care) | 0.002 | 0.069 | 0.2 | -0.082 | 0.068 | -7.9 | -0.085 | 0.068 | -8.1 | -0.076 | 0.080 | -7.3 | -0.087 | 0.080 | -8.3 |
| STEM plus health care | 0.262Note *** | 0.075 | 29.9 | 0.249Note *** | 0.072 | 28.3 | 0.255Note *** | 0.072 | 29.0 | 0.269Note *** | 0.066 | 30.8 | 0.248Note *** | 0.066 | 28.1 |
Sources: Statistics Canada, Longitudinal Worker File, Postsecondary Student Information System, 2006 Census of Population and T1 Family File. |
|||||||||||||||
Conclusion
Workers who experience a permanent layoff—a job loss without re-employment with the same firm in the same or subsequent year—typically see substantial declines in earnings, even several years later. One approach to dealing with a permanent layoff is to return to school. Understanding the outcomes associated with post-layoff educational decisions is informative for displaced workers and policy makers alike.
The findings in this study suggest that, compared with individuals who did not enrol in postsecondary education following a permanent layoff, individuals who graduated from a college or CEGEP certificate or diploma program after job loss registered substantially larger percentage increases in annual earnings between one year before the layoff and five years after the layoff. The relative earnings increases were particularly large among individuals who graduated from short STEM or health care programs. More moderate relative increases in earnings were registered by individuals who took independent credits. In contrast, graduates from a short non-STEM (except health care) program or a microcredential (a short program requiring only a few courses) after job loss experienced no relative earnings gains. In fact, graduates of microcredentials registered substantial earnings losses compared with individuals who did not enrol at all. Finally, displaced workers who enrolled in, but did not graduate from, a short program experienced similar earnings trajectories compared with those who did not enrol.
These results are important considering the coping strategies typically adopted by workers affected by a permanent layoff. Among the three groups of graduates examined in this study, almost one-quarter (24.2%) of them obtained a microcredential. However, their relative earnings growth was lower than what was registered by displaced workers who did not enrol in a postsecondary program. The remaining three-quarters (75.8%) of graduates obtained a college or CEGEP certificate or diploma and saw superior relative earnings growth compared with non-enrollees. Interestingly, STEM and health care graduates fared much better than non-STEM (except health care) graduates following a permanent layoff, but a majority (59.2%) obtained their credentials in a non-STEM (except health care) program.
Among individuals who enrolled in a program from which they did not graduate, a strong majority (71.5%) took independent credits, perhaps because of time constraints associated with bills and family responsibilities. This group registered somewhat larger relative increases in post-layoff earnings than individuals who did not return to school. Perhaps the flexibility of taking very specific, targeted courses over a short period of time contributed to the labour market success of these displaced workers.
When the data become available, future research can extend the analysis to include more years after the displacement. This will be interesting given the notable differences in post-layoff earnings patterns documented in the current study over a relatively short period of time. Specifically, individuals who graduated from a short program experienced substantial earnings losses as they completed their studies. Only with several more years of data will it be possible to obtain a more complete picture of the post-layoff earnings trajectories associated with the various educational strategies examined in this study.
Finally, the results presented in this study apply to individuals who chose specific post-layoff educational paths (i.e., they are rough estimates of average treatment effects). However, only a small minority of recently displaced workers opt to reinvest in their human capital by returning to school. Whether the results in this study would apply to a broader range of displaced workers should more of them decide to return to school (either through shifting preferences, changing economic conditions or policy incentives) depends largely on the unknown marginal treatment effects—the benefits associated with returning to school among a sample who have historically chosen not to do so.Note
References
Bonikowska, A., and R. Morissette. 2012. Earnings Losses of Displaced Workers with Stable Labour Market Attachment: Recent Evidence from Canada. Analytical Studies Branch Research Paper Series, no. 346. Statistics Canada Catalogue no. 11F0019M. Ottawa: Statistics Canada.
Chan, P. C. W., T. Handler, and M. Frenette. 2021. Gender Differences in STEM Enrolment and Graduation: What Are the Roles of Academic Performance and Preparation? Economic and Social Reports, 1 (11). Statistics Canada Catalogue no. 36-28-001. Ottawa: Statistics Canada.
Chan, P. C. W., Morissette, R., and Frenette, M. 2011. Workers Laid-off During the Last Three Recessions: Who Were They, and How Did They Fare? Analytical Studies Branch Research Paper Series, no. 337. Statistics Canada Catalogue no. 11F0019M. Ottawa: Statistics Canada.
Chan, P. C. W., R. Morissette, and H. Qiu. 2020. COVID-19 and Job Displacement: Thinking about the Longer Term. StatCan COVID-19: Data to Insights for a Better Canada. Statistics Canada Catalogue no. 45280001. Ottawa: Statistics Canada.
Couch, K. A., and Dana W. Placzek. 2010. “Earnings Losses of Displaced Workers Revisited.” American Economic Review 100 (1): 572–589.
Eliason, M., and D. Storrie. 2006. “Lasting or latent scars? Swedish evidence on the long-term effects of job displacement.” Journal of Labor Economics 24 (4): 831–856.
Employment and Social Skills Development Canada. 2017. Evaluation of the Canada-Ontario Labour Market Development Agreement. Synthesis Report. https://www.canada.ca/en/employment-social-development/corporate/reports/evaluations/labour-market-development-agreement-ontario.html#h2.2
Frenette, M. 2021. Claiming postsecondary education tax credits: Differences by level of parental income and implications for trends in enrolment rates. Economic and Social Reports, 1 (11). Statistics Canada Catalogue no. 36-28-001. Ottawa: Statistics Canada.
Frenette, M., and Handler, T. 2020a. Which Bachelor’s Degree Programs Were Associated with the Highest Pay Prior to the COVID-19 Pandemic? A Focus on Very Detailed Fields of Study. Economic Insights, no. 120, Statistics Canada Catalogue no. 11-626-X. Ottawa: Statistics Canada.
Frenette, M., and Handler, T. 2020b. Which Master’s Degree Programs Were Associated with the Highest Pay Prior to the COVID-19 Pandemic? A Focus on Very Detailed Fields of Study. Economic Insights, no. 121, Statistics Canada Catalogue no. 11-626-X. Ottawa: Statistics Canada.
Frenette, M., and Handler, T. 2020c. Which Doctoral Degree Programs Were Associated with the Highest Pay Prior to the COVID-19 Pandemic? A Focus on Very Detailed Fields of Study. Economic Insights, no. 122, Statistics Canada Catalogue no. 11-626-X. Ottawa: Statistics Canada.
Frenette, M., R. Upward, and P.W. Wright. 2011. The Long-term Earnings Impact of Postsecondary-education Following Job Loss. Analytical Studies Branch Research Paper Series, no. 334. Statistics Canada Catalogue no. 11F0019M. Ottawa: Statistics Canada.
Handler, T. and Frenette, M. 2022. Postsecondary education decisions following a permanent layoff. Economic and Social Reports, https://www150.statcan.gc.ca/n1/en/catalogue/36280001202200900002. Statistics Canada Catalogue no. 36-28-001. Ottawa: Statistics Canada.
Handler, T. and Morissette, R. 2022. Fine tuning or re-skilling? Educational strategies of prime-aged displaced workers. Economic and Social Reports, 2 (1). Statistics Canada Catalogue no. 36-28-001. Ottawa: Statistics Canada.
Hijzen, A., R. Upward, and P.W. Wright. 2010. “The income losses of displaced workers.” Journal of Human Resources 45 (1): 243–269.
Huttunen, K., J. Møen, and K. Salvanes. 2006. How Destructive is Creative Destruction? Investigating Long-term Effects of Worker Displacement. IZA Discussion Paper 2316. Bonn, Germany: Institute for the Study of Labor.
Jacobson, L., R.J. Lalonde, and D.G. Sullivan. 1993. “Earnings losses of displaced workers.” American Economic Review 83 (4): 685–709.
Jacobson, L., R.J. Lalonde, and D.G. Sullivan. 2005. “Estimating the returns to community college schooling for displaced workers.” Journal of Econometrics 125 (1–2): 271–304.
Li, C. 2006.Canada’s Private colleges: The Lesser Known Players in Postsecondary Education. Analysis in Brief, no. 36. Statistics Canada Catalogue no. 11-621-MIE. Ottawa: Statistics Canada.
Morissette, R. and H. Qiu. 2021. Workers’ Responses to Job Loss When Employment Opportunities are Scarce. Economic and Social Reports, 1 (2). Statistics Canada Catalogue no. 36-28-001. Ottawa: Statistics Canada.
Morissette, R., X. Zhang, and M. Frenette. 2007. Earnings Losses of Displaced Workers: Canadian Evidence from a Large Administrative Database on Firm Closures and Mass Layoffs. Analytical Studies Branch Research Paper Series, no. 291. Statistics Canada Catalogue no. 11F0019M. Ottawa: Statistics Canada.
- Date modified: