
Quality of Employment in Canada
Trade union density rate, 1997 to 2021
Skip to text
Text begins
From 1997 to 2021, both the collective bargaining coverage rate and the unionization rate declined among employees as a result of a fall in unionization in the private sector. While the coverage rate fell 2.8 percentage points to 30.9%, the unionization rate fell 1.9 percentage points to 29.0%. The two rates are closely aligned, and the proportion of employees who are covered, but not a member of a union has hovered around only 2% since the early 2000s.
The trade union density rate, also known as the unionization rate, is the number of employees who are union members as a proportion of the total number of employees. Employment in a unionized workplace is often associated with higher wages, more benefits and greater job security. While non-members covered by a collective bargaining agreement tend to have conditions similar to those of union members, the unionization rate can provide a proxy measure of workers’ representation and the influence of unions. In association with the union coverage rate, this indicator of quality of employment can be used to help assess trends in the state of industrial relations in a country.
The trade union density rate for all employees and for different demographic and worker characteristics is calculated using data from the Labour Force Survey (LFS).
Historical trends, 1997 to 2021
After decreasing from 1997 to 2019, the unionization rate increased 1.1 percentage points to 29.4% in 2020. The 2020 increase was largely due to the concentration of job losses among non-unionized private sector employees during the COVID-19 pandemic. With private sector employment recovering in 2021, the unionisation rate subsequently fell 0.4 percentage points to 29.0%.
The 1997-to-2021 decrease in the unionization rate was driven by the private sector. The unionization rate for private sector employees fell from 19.0% in 1997 to 13.8% in 2021. In contrast, 74.1% of public sector employees were union members in 2021, 4.3 percentage points higher than in 1997.
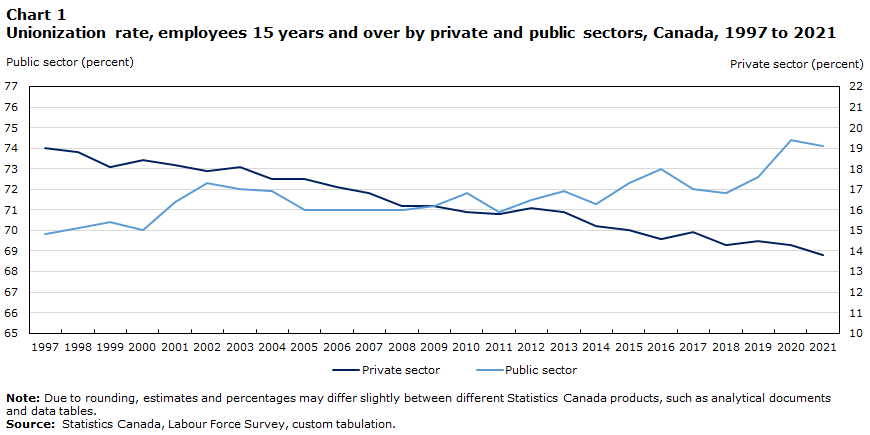
Data table for Chart 1
| Public sector | Private sector | |
|---|---|---|
| percent | ||
| 1997 | 69.8 | 19.0 |
| 1998 | 70.1 | 18.8 |
| 1999 | 70.4 | 18.1 |
| 2000 | 70.0 | 18.4 |
| 2001 | 71.4 | 18.2 |
| 2002 | 72.3 | 17.9 |
| 2003 | 72.0 | 18.1 |
| 2004 | 71.9 | 17.5 |
| 2005 | 71.0 | 17.5 |
| 2006 | 71.0 | 17.1 |
| 2007 | 71.0 | 16.8 |
| 2008 | 71.0 | 16.2 |
| 2009 | 71.2 | 16.2 |
| 2010 | 71.8 | 15.9 |
| 2011 | 70.9 | 15.8 |
| 2012 | 71.5 | 16.1 |
| 2013 | 71.9 | 15.9 |
| 2014 | 71.3 | 15.2 |
| 2015 | 72.3 | 15.0 |
| 2016 | 73.0 | 14.6 |
| 2017 | 72.0 | 14.9 |
| 2018 | 71.8 | 14.3 |
| 2019 | 72.6 | 14.5 |
| 2020 | 74.4 | 14.3 |
| 2021 | 74.1 | 13.8 |
|
Note: Due to rounding, estimates and percentages may differ slightly between different Statistics Canada products, such as analytical documents and data tables. Source: Statistics Canada, Labour Force Survey, custom tabulation. |
||
In both 1997 and 2021, the unionization rate was higher among employees aged 25 to 54 and 55 years and over than among employees aged 15 to 24. Yet the unionization rate declined among employees aged 25 to 54 (-3.3 percentage points to 31.5%) and 55 years and over (-4.1 percentage points to 31.2%), but increased among youth (+4.2 percentage points to 15.0%) over this period.
The growth among youth is partly attributable to an employment increase and a higher unionization rate for younger employees in the healthcare and social assistance industry.
A recent snapshot
Despite major shifts in the labour market in 2020 and 2021 in the context of the COVID-19 pandemic, key differences in unionization between demographic groups and industries remained aligned with pre-pandemic trends.
As a result of their greater concentration in the public sector, women accounted for a larger share of all union members (53.0%) than men (47.0%) in 2021.
Industries with high unionization rates such as educational services (71.2%), public administration (71.1%), and health care and social assistance (51.6%), also tended to have the highest proportions of employees who were in the public sector.
In contrast, professional, scientific and technical services (2.5%) and agriculture (2.6%), had the lowest proportions of employees who were union members in 2021. Nearly all employees in these two industries were in the private sector.
Unionisation rates also varied by population groups designated as visible minorities. Among 25-to-54 year-olds, the unionization rate of employees was relatively high among the Black population (36.3%) and among Canadians who are not Indigenous nor a visible minority (34.6%) and relatively low among the Chinese population (18.2%).
In 2021, while employees covered by a collective bargaining agreement had higher average hourly wages than those who were not, there was virtually no difference in the hourly wages of union members, and non-members covered by a collective bargaining agreement.
Start of text box
Information on the indicator
Description or definition
The trade union density rate indicator measures the unionization rate, which is the number of employees who are union members expressed as a percentage of the total number of employees.
Source
Statistics Canada, Labour Force Survey, 1997 to 2021 and Labour Force Survey Supplement, 2021.
Information for interpretation
For more information on the Labour Force Survey (LFS) methodology and population coverage, please consult the Guide to the Labour Force Survey, 2020.
The LFS estimates are based on a sample and are therefore subject to sampling variability. The analysis focuses on differences between estimates that are statistically significant at the 95% confidence level. Due to rounding, estimates and percentages may differ slightly between different Statistics Canada products, such as analytical documents and data tables.
Industry coding is based on the North American Industry Classification System (NAICS) 2017.
Beginning January 1997, employees are classified as: a) union member; b) not a member, but covered by a union contract or collective agreement; or c) non-unionized.
Other related information
A Statistics Canada publication Unionization rates falling has previously examined trends in unionization from 1981 to 2014.
Additional Statistics Canada data are available on the following subjects:
End of text box
- Date modified: