
Latest Developments in the Canadian Economic Accounts
Canada's merchandise trade with the U.S. by state

Archived Content
Information identified as archived is provided for reference, research or recordkeeping purposes. It is not subject to the Government of Canada Web Standards and has not been altered or updated since it was archived. Please "contact us" to request a format other than those available.

The value of Canada’s total merchandise trade (exports plus imports) with the United States on a customs basis reached $673 billion in 2016, accounting for 64.0% of Canada’s total merchandise trade with the world. This was down slightly from 2015 when a record $688 billion was traded between the two countries.
Most of the data used in this paper are drawn from a new CANSIM table (228-0080), which provides monthly data on Canada's total merchandise imports and exports with the United States and also by US state and Canadian province. The data are available at the Harmonized System (HS) section level dating back to January 1990.
From 1990 to 2016, Canada’s total trade with the United States more than tripled. The most rapid growth occurred from 1992 to 1995, with exports to the United States increasing by 65.3% and imports rising by 56.2%. This expansion coincided with the signing of the North American Free Trade Agreement in 1992 and its implementation in 1994.
Canada’s exports to the United States totalled $394 billion in 2016 and imports were valued at $278 billion, accounting for 76.3% of Canada’s total exports and 52.2% of total imports.
Trade patterns with the United States on a regional basis highlight the integration of industries between the two countries. Proximity, transport infrastructure and government policies have all contributed to these interdependencies. In 2016, 14 of Canada’s top 20 trading partners were US states. The states with the largest shares of total trade with Canada were Michigan, Illinois, California, New York and Texas. In fact, Michigan has been Canada’s top trading partner among U.S. states every year since 1990.
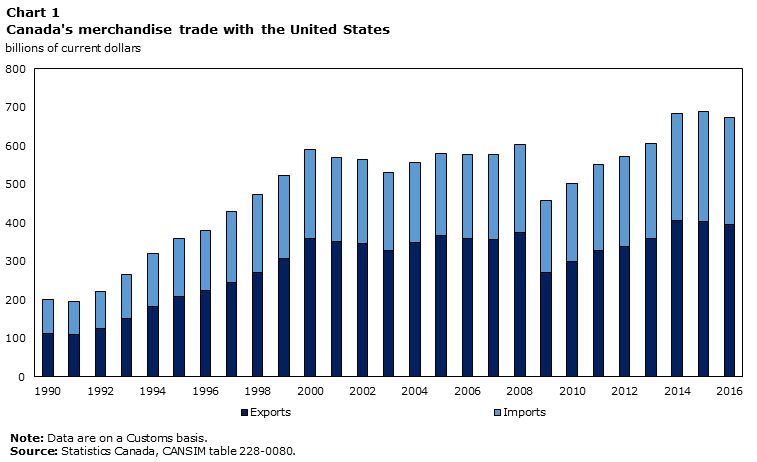
Data table for Chart 1
| Exports | Imports | |
|---|---|---|
| billions of current dollars | ||
| 1990 | 111.6 | 87.9 |
| 1991 | 109.7 | 86.4 |
| 1992 | 125.7 | 96.5 |
| 1993 | 150.7 | 113.8 |
| 1994 | 183.3 | 137.3 |
| 1995 | 207.8 | 150.7 |
| 1996 | 223.2 | 157.0 |
| 1997 | 243.9 | 184.4 |
| 1998 | 269.9 | 203.6 |
| 1999 | 308.1 | 215.6 |
| 2000 | 359.3 | 229.7 |
| 2001 | 351.8 | 218.3 |
| 2002 | 345.4 | 218.5 |
| 2003 | 326.8 | 203.8 |
| 2004 | 348.1 | 209.0 |
| 2005 | 365.7 | 215.2 |
| 2006 | 359.1 | 217.8 |
| 2007 | 355.6 | 220.9 |
| 2008 | 375.5 | 227.2 |
| 2009 | 270.1 | 186.8 |
| 2010 | 298.6 | 203.3 |
| 2011 | 329.0 | 221.4 |
| 2012 | 339.2 | 233.9 |
| 2013 | 357.9 | 247.8 |
| 2014 | 404.7 | 278.5 |
| 2015 | 402.2 | 285.4 |
| 2016 | 394.4 | 278.3 |
|
Note: Data are on a Customs basis. Source: Statistics Canada, CANSIM table 228-0080. |
||
The auto industry is a driver of trade between Canada and Michigan
Michigan is the principal destination and origin of Canada’s traded commodities with the United States. In 2016, exports to Michigan totalled $66 billion, representing 16.8% of all exports to the United States. More than half of these exports consisted of motor vehicles.
Canada’s imports from the United States were also dominated by Michigan, accounting for $29 billion in 2016, or 10.4% of Canada’s total imports from that country. More than half of these imports were motor vehicles or motor vehicle parts. The strong integration of the auto industries between Michigan and Ontario, and the presence of the largest auto makers and distribution centres in the United States make Michigan Canada’s largest trading partner for both imports and exports with the United States. If Michigan was a country, it would be Canada’s second-largest trading partner ahead of China.
Another key state in terms of the automobile sector is Ohio. The auto industries of Ohio and Ontario are also well integrated, contributing $39 billion worth of merchandise traded between the two jurisdictions in 2016. Ohio was Canada’s second most important import source by state in 2016, accounting for $23 billion or 8.3% of all imports from the United States. Ohio was also the destination for $16 billion or 4.1% of Canada’s exports to the United States, ranking it as the seventh-largest export state.
Overall in 2016, motor vehicles and parts accounted for more than one-fifth of all traded commodities between Canada and the United States.
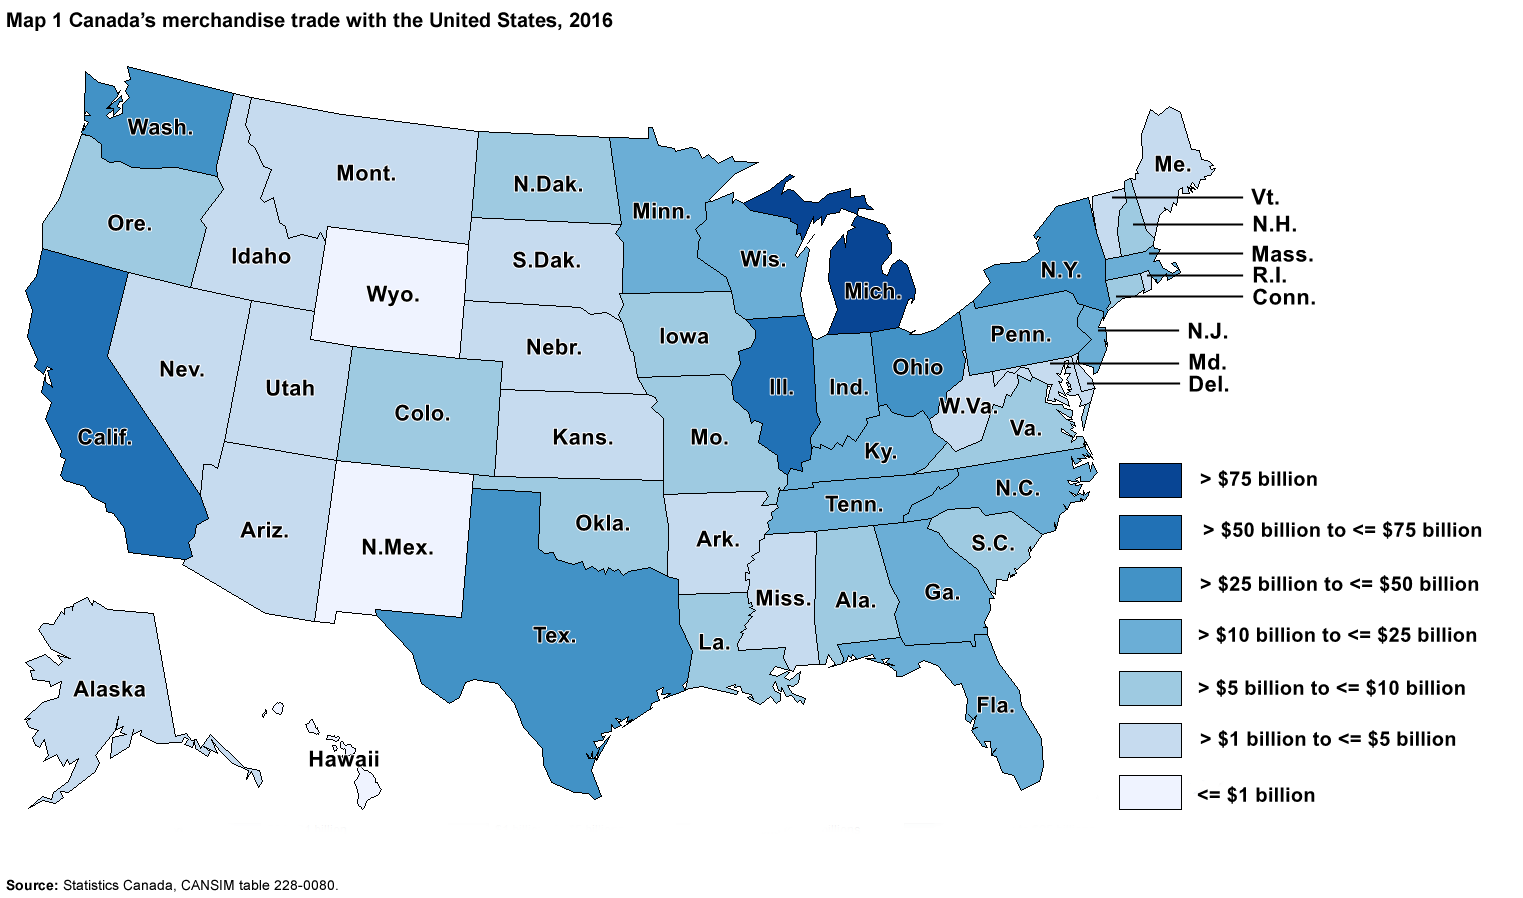
Description for map 1
The title of the map is "Canada's merchandise trade with the United States, 2016"
The map is of the United States with state boundaries drawn and standard abbreviations used to identify each state. The map indicates Canada's total merchandise trade (imports plus exports) on a Customs basis for all 50 states in 2016. On this map, darker shades of blue indicate a higher amount of total trade, and lighter shades of blue indicate lower amounts of total trade.
Category 1 (darkest blue) represents states where total merchandise trade is greater than $75 billion. Michigan (Mich.) is the only state included in category 1.
Category 2 represents states where total merchandise trade is greater than $50 billion to less than or equal to $75 billion. The states included in category 2 are Illinois (Ill.) and California (Calif.).
Category 3 represents states where total merchandise trade is greater than $25 billion to less than or equal to $50 billion. The states included in category 3 are New York (N.Y.), Texas (Tex.), Ohio and Washington (Wash.).
Category 4 represents countries where total merchandise trade is greater than $10 billion to less than or equal to $25 billion. The states included in category 4 are Pennsylvania (Penn.), Indiana (Ind.), Tennessee (Tenn.), New Jersey (N.J.), Minnesota (Minn.), Kentucky (Ky.), Wisconsin (Wis.), Massachusetts (Mass.), Georgia (Ga.), North Carolina (N.C.) and Florida (Fla.).
Category 5 represents states where total merchandise trade is greater than $5 billion to less than or equal to $10 billion. The states included in category 5 are Missouri (Mo.), South Carolina (S.C.), Alabama (Ala.), North Dakota (N.Dak.), Iowa, New Hampshire (N.H.), Oregon (Ore.), Virginia (Va.), Connecticut (Conn.), Louisiana (La.), Colorado (Colo.) and Oklahoma (Okla.).
Category 6 represents states where total merchandise trade is greater than $1 billion to less than or equal to $5 billion. The states included in category 6 are Vermont (Vt.), Utah, Montana (Mont.), Kansas (Kans.), Maine (Me.), Maryland (Md.), Arizona (Ariz.), West Virginia (W.Va.), Mississippi (Miss.), Nevada (Nev.), Idaho, Arkansas (Ark.), Nebraska (Nebr.), Alaska, Rhode Island (R.I.), Delaware (Del.) and South Dakota (S.Dak.).
Category 7 (lightest blue) represents states where total merchandise trade is less than or equal to $1 billion. The states included in category 7 are Wyoming (Wyo.), New Mexico (N.M.) and Hawaii.
Source: Statistics Canada, CANSIM table 228-0080.
Oil cycle with Illinois
Illinois was the second-largest trading partner in terms of total trade, and the third-largest destination for Canadian exports to the United States in 2016, accounting for $36 billion or 9.2% of Canada’s total US exports. The main commodity exported to Illinois in 2016 was crude oil, representing more than half of Canada’s total exports to the state. Illinois is an important destination for Western Canada’s bituminous crude oil as it is home to many refineries that are equipped to process heavy crude oil.
With the significant pipeline interconnectivity between Western Canada and Illinois, Canadian bituminous crude oil production is largely driven by exports rather than domestic demand. Exports of crude oil to Illinois peaked at $36 billion in 2014, but have fallen somewhat since the decline of oil prices.
Illinois is also a key import source of merchandise for Canada, ranking third in 2016 with 6.6% of Canada’s total imports from the United States. One of the main commodities imported in 2016 were diluents for crude bitumenNote 1, accounting for 16.7% of Canada’s total imports from Illinois. In order to improve flow through pipelines, bituminous crude oil from Western Canada must first be diluted. Canada’s exports of crude oil to Illinois mostly consist of diluted bitumen. Once the diluted bitumen reaches the Illinois refineries, the diluent is separated from the bitumen and returned to Canada, to be used again.
California ranks second as an export destination
Canada’s exports to California were valued at $38 billion in 2016, representing 9.7% of Canada’s total exports to the United States. Almost two-thirds of these exports consisted of motor vehicles, which reached a record $24 billion in 2016. Large auto distribution centres in California are behind these strong exports. Many motor vehicles manufactured in Canada and destined for the United States market transit through distribution centres in California before entering the US retail market.
Imports from California are also significant for Canada, ranking seventh in terms of Canada’s total imports from the United States. Fruits and vegetables are the dominant commodities entering Canada from California.
Exports of gold to New York
New York is Canada’s fourth-largest trading partner among the U.S. states. Exports to New York were worth $27 billion in 2016, or 6.8% of total U.S. exports, with unwrought gold being the top commodity exported. New York City is one of the largest financial centres in the world, and as a result Canada’s exports of gold to New York State primarily represent asset transfers within the banking industry.
Courier shipments contributed the most to Canada’s imports from New York, representing over 41.4% of the $18 billion imported in 2016. Since 2000, Canada’s imports within this category from New York have almost tripled, supported by the growing popularity of e-commerce.
Crude oil trade with Texas
Texas is also important for Canada’s trade activity with the United States. In 2016, Canada’s exports to Texas totalled $22 billion and imports from Texas amounted to $18 billion. Crude oil is one of the most traded commodities with Texas for both exports and imports. In North America, Texas has the largest number of refineries equipped to process the heavy crude oil that is produced in Western Canada. As a result, the state is a natural market for many Canadian heavy oil exporters.
Refineries in the Eastern Canadian provinces are equipped to process light crude oil, and as such, they have historically relied upon imported crude oil from the North Sea or the Middle-East. With the discovery of major shale oil fields in Texas, such as the Eagle Ford formation, the state became one of the main sources of light crude oil for these Canadian refineries. Canadian imports of crude oil from Texas rose from $318 million in 2012 to peak at $7.3 billion in 2014. Crude oil imports from Texas then fell back to $1.6 billion in 2016, due in part to lower oil prices.
Start of text boxAll of the information presented in this paper is on a customs basis.
Customs-based trade in goods data aims to capture the movement of merchandise across the Canadian border, both outgoing (exports), and incoming (imports). In other words, this approach measures the two-way physical flow of commodities crossing economic territories.
For customs-basis imports, the country within which the good was extracted, produced or last processed, known as the country of origin, determines the trading partner. For customs-basis exports, the final destination known to the company in Canada that is exporting a good determines the trading partner.
Trade in goods data on a balance of payments (BOP) basis aims to capture the international movement of products among resident and non-resident owners as sales (exports) or purchases (imports). As a result, for imports, the country within which the good was last owned determines the trading partner. To capture this information, the country of export variable, as opposed to the country of origin, is the selected proxy for reflecting last country of ownership. For exports, exporters are asked to report the best-known final destination of their product, which is considered in line with the change in ownership principle.
This conceptual difference leads to different results when looking at Canada’s trade data with the United States. For example, in 2016, Canada’s total imports from the United States on a balance of payments basis were set at $360 billion, while customs-based data showed $278 billion. For export data, the difference is minimal.
The Canadian international merchandise trade program calculates Canada’s trade balance monthly using seasonally adjusted data, on a balance of payments basis.
Data source
The data for this paper were drawn from the new CANSIN table 228-0080 and the Canadian International Merchandise Trade Database.
| Total trade | Total exports | Total imports | |
|---|---|---|---|
| millions of dollars | |||
| United States | 672,660 | 394,384 | 278,276 |
| Michigan | 94,970 | 66,158 | 28,813 |
| Illinois | 54,627 | 36,254 | 18,373 |
| California | 52,291 | 38,195 | 14,096 |
| New York | 44,346 | 26,664 | 17,683 |
| Texas | 40,059 | 21,714 | 18,345 |
|
Note: Data are on a customs basis. Source: Statistics Canada, CANSIM table 228-0080. |
|||
- Date modified: