Common menu bar links
Highlights
Archived Content
Information identified as archived is provided for reference, research or recordkeeping purposes. It is not subject to the Government of Canada Web Standards and has not been altered or updated since it was archived. Please "contact us" to request a format other than those available.
Third quarter 2008
Household net worth declines led by large stock market losses
Canadian stock prices fell significantly during the third quarter of 2008, resulting in a 3.2% drop in household net worth, equivalent to a decline of $191 billion. This was the largest percentage drop since the third quarter of 1998 when Canadian stock prices fell in response to the Asian financial crisis.
In comparison, household net worth in the United States fell 4.7% in the third quarter, their fourth consecutive quarterly decline.
Canadian equity markets were down by over 18% in the third quarter, as measured by the Standard and Poor’s / Toronto Stock Exchange composite index which closed in September at 11,753, led by substantial declines in energy stocks. The corresponding loss in directly held equities combined with the related loss in the value of pension and life insurance assets of households was the principal factor behind the drop in net worth. Also contributing were slower growth in residential real estate values and continued household borrowing. Total household assets fell 2.2% in the third quarter of 2008. Chart H.1 Household sector assets decline

Household debt growth slowed in the third quarter owing largely to lower new mortgage borrowing. Household debt (consumer credit and mortgages) relative to net worth, edged up during the quarter. Households had 20.9 cents of debt for every dollar of net worth and $1.27 of debt for every dollar of disposable income.
However, the increase in household debt relative to net worth was larger in the US in the third quarter. While this ratio has a similar pattern in both countries from 1990 to 2008, it is currently lower in Canada, having diverged significantly between 1999 and 2003. This divergence was largely due to the differential effect over that period of the stock market downturn on equity assets, given the U.S. household sector’s higher exposure to traded equities as compared to that of Canada’s. Mortgage borrowing was also a contributing factor. Between year-end 1999 and 2003, household mortgage debt in the U.S. rose 52%, compared to 23% for Canada.
Chart H.2 Household debt to net worth: Canada, United States

Financial institutions’ marketable assets decrease
Canadian financial institutions, including institutional investors such as trusteed pension plans and mutual funds, were also affected by the drop in the equity markets in the third quarter. This resulted in a notable decrease in the value of their marketable securities.
The value of Canadian equities and mutual fund units held by financial institutions declined more than 16% in the third quarter. The decline in foreign equity markets resulted in a similar effect on their foreign portfolio holdings with the value of foreign investments falling by more than 6% in the third quarter of 2008.
Corporate debt-to-equity ratio edges up
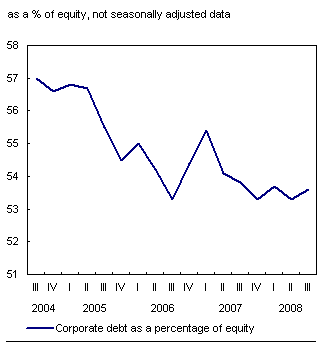
Increased borrowing in the Canadian corporate sector translated into a slight increase in non-financial private corporations’ debt-to-equity ratio, which has trended down for much of the last two decades. In the third quarter of 2008, corporations had 53.6 cents of credit market debt for every dollar of equity (at book value), as the growth rate in credit market borrowing exceeded that of equity issuances plus saving.
Chart H.3 Corporate debt-to-equity ratio edges up

Financing activity increased during the quarter, as non-financial corporations increased investment in plant, equipment and inventories, with notable increases in borrowing in the form of bank loans and bond issues. Corporations continued to record strong profit growth during the quarter and the non-financial corporate sector remained a net lender to the rest of the economy.
Government net debt-to-gross domestic product declines further
The federal government’s credit market debt decreased in the third quarter of 2008. Funds received from the sale of radio spectrum licenses during the quarter helped reduce its demand for funds
The drop in federal debt was partially offset by increased borrowings by other levels of government. Overall, total government net debt (at book value) as a percentage of gross domestic product (GDP) edged down to just over 35% in the third quarter, compared to the peak of 92% in mid 1996.
Net foreign debt falls, led by Canadian direct investment abroad
Canada’s net foreign indebtedness (with tradable securities on a market value basis) declined to $14.6 billion in the third quarter. Robust foreign direct investment abroad was the major factor in the reduction in Canada’s net foreign debt. Direct investment abroad by Canadian firms rose by $30.6 billion to $593.7 billion, on the largest outflows by Canadian companies in four years. Global stock market declines also contributed to lower net foreign debt, as non-residents had larger losses on their Canadian equities than Canadian investors had on foreign stocks.
Reduction in net foreign debt contributes to the growth in national net worth
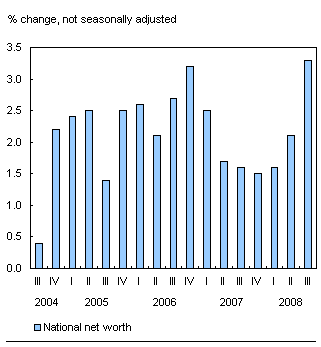
Even with the large decline in household sector net worth, growth in national net worth (total assets less liabilities for all sectors) remained robust, with national net worth up 3.3%, in the third quarter of 2008. The growth in national net worth was attributable to a decline in net liabilities to non-residents and an increase in economy wide non-financial assets (national wealth). This resulted in a per capita national net worth of $180,000, up from $174,800 in the second quarter of 2008.
National wealth amounted to just over $6 trillion, as growth accelerated to 2.8%, up from the second quarter, with gains in non-residential and residential real estate contributing to the increase.
Chart H.4 National net worth increase impacted by a decline in net foreign debt


