Common menu bar links
National balance sheet accounts
Archived Content
Information identified as archived is provided for reference, research or recordkeeping purposes. It is not subject to the Government of Canada Web Standards and has not been altered or updated since it was archived. Please "contact us" to request a format other than those available.
First quarter 2009
National balance sheet accounts note to readers
Household net worth declines, for the third consecutive quarter
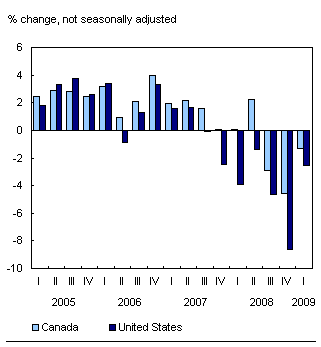
Household net worth declined by $72 billion (-1.3%) in the first quarter of 2009, a much slower rate of decline than in the last two quarters of 2008 where cumulative losses totalled $438 billion. The value of both financial and non-financial assets of the household sector decreased, as a result of ongoing losses in the stock market and lower real estate values. Household net worth fell 1.3% in Canada compared with a 2.6% decline in the United States.
Chart H.1 Household net worth continues to decline, Canada and U.S.

Growth in credit market debt (consumer credit, mortgages, and loans) of the household sector slowed to less than 1% during the first quarter of 2009, as new mortgage borrowing slowed.
Total household liabilities relative to net worth edged up modestly in the first quarter, increasing to 24.9 cents of debt for every dollar of net worth, from 24.4 cents in the fourth quarter of 2008.
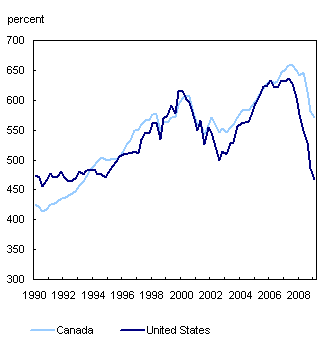
The wealth shock has been smaller in Canada than in the United States. As a percentage of personal disposable income, household net worth has fallen faster in the United States than in Canada since the third quarter of 2007.
Chart H.2 Household net worth as a percent of personal disposable income, Canada and U.S.

Canadian equity markets, as measured by the Standard & Poor's / Toronto Stock Exchange composite index, fell 3.0% in the first quarter of 2009, following a drop of 24% in the previous quarter. The drop contributed to a continuing decline in the value of household equity holdings.
Non-financial corporations’ financial position largely unchanged
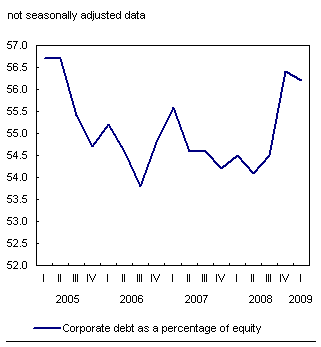
Profits of Canadian corporations weakened again in the first quarter of 2009, as falling commodity prices and declines in manufacturing and wholesale trade drove down corporate profits. However, non-financial private corporations’ debt-to-equity ratio (at book value) was largely unchanged in the first quarter.
Chart H.3 Corporate leverage declines slightly

Federal government debt increases for a second consecutive quarter
The federal government’s credit market debt rose by 10.5% in the first quarter of 2009, slightly less than the record growth in the previous quarter (+14.2%). Ongoing borrowing, partly in support of the federal government's economic stimulus plan and the Insured Mortgage Purchase (IMP) Program, contributed to the higher level of the federal government’s credit market debt. The IMP program, which was introduced last fall, is intended to provide long-term stable funding to lenders and help ensure availability of funds to Canadian consumers and businesses.
The increase in federal debt during the quarter was coupled with increases in the debt of other levels of government, albeit at a much slower pace. Overall, total government net debt (at book value) as a percentage of gross domestic product was up, from 35% in the third quarter of 2008, the lowest since this series began in 1990, to 38% in the quarter. It remains well below the 92% reached in mid-1996.
Financial institutions continued to restructure
Lending institutions and institutional investors, such as trusteed pension plans and mutual funds, recorded a small deceleration in financial asset growth. The drop in the value of their equity holdings in the first quarter of 2009 was less pronounced than in the latter part of 2008. The value of Canadian equities and mutual fund units held by financial institutions fell marginally in the quarter, compared with the declines of 19.2% and 20.6%, in the third and fourth quarter of 2008, respectively.
Institutional investors continued to reduce their foreign portfolio asset holdings in favour of Canadian short-term paper and bonds, in part associated with the continued above-average issuances of National Housing Act Mortgage Backed-Securities in the quarter.
National net worth
For the first time since 1995, national net worth (sum of non-financial assets plus net foreign assets) declined, down 0.4%. Deceleration in the growth of national saving and business investment contributed to this decline. On a per capita basis, national net worth has fallen from $180,000 in the fourth quarter of 2008 to $178,800 in the first quarter of 2009.
Canada’s net foreign asset position (on a market value basis) narrowed in the first quarter of 2009. Canadian direct investment abroad continued to be a major component sustaining Canada’s net foreign asset position, largely reflecting the revaluation effect of the depreciation of the Canadian dollar relative to the U.S. dollar.
Statistical tables
- Table H.1 National balance sheet accounts
- Table H.2 National balance sheet, market value
- Table H.3 Credit market summary table
Information on methods and data quality available in the Integrated Meta Data Base: 1806.

