Common menu bar links
National balance sheet accounts
Archived Content
Information identified as archived is provided for reference, research or recordkeeping purposes. It is not subject to the Government of Canada Web Standards and has not been altered or updated since it was archived. Please "contact us" to request a format other than those available.
Fourth quarter 2008
National balance sheet accounts note to readers
Household net worth retreated for the second consecutive quarter, declining $252 billion, or 4.4%, in the fourth quarter, as stock market prices continued to fall. On a per capita basis, household net worth has fallen from $179,300 in the second quarter of 2008 to $165,300 in the fourth quarter, or $14,000.
Canadian and international equity markets retreated further this quarter, with the Standard and Poor's / Toronto Stock Exchange composite index closing in December 2008 at 8,988, down by 24% from the previous quarter, led by substantial declines in energy stocks. This contributed to a second quarterly decrease in household net worth, down 4.4%, the largest quarterly drop in the series, which dates back to 1990. In comparison, household net worth in the United States fell 9% in the fourth quarter, their sixth consecutive quarterly decline.
Household net worth declines driven by financial assets
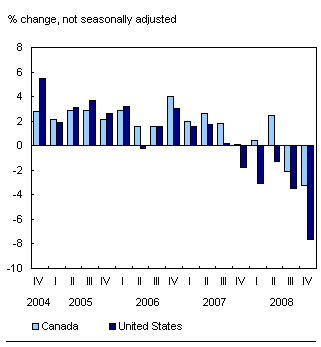
The total value of household assets fell 3.2% in the fourth quarter of 2008.This compares to the 2.7% drop in the third quarter of 1998 when Canadian stock prices were affected by the Asian financial crisis. The turmoil on equity markets significantly reduced the value of shareholdings as well as that of pension and life insurance assets of households. The decline in households' assets was partially offset by the increase in non-financial assets, specifically residential structures.
In comparison, household assets in the United States have been declining since the fourth quarter of 2007, with total assets declining by 7.6% in the fourth quarter of 2008.Chart H.1 Household sector assets: Canada, United States

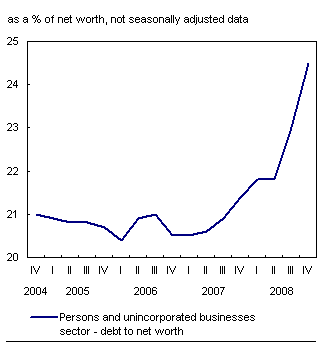
Credit market debt of the household sector grew 1.7% and reached $1.3 trillion at the end of the fourth quarter of 2008, a smaller increase than the growth of 2.4% in the previous quarter, as mortgage borrowing slowed in the fourth quarter. Total household liabilities relative to net worth edged up during the quarter. Households had 24.5 cents of debt for every dollar of net worth.
For further analysis, a note on debt indicators of households and other non-financial sectors is available in the feature article, Financial Indicators.
Chart H.2 Household debt-to-net worth ratio continues to rise

Corporate debt-to-equity ratio increases
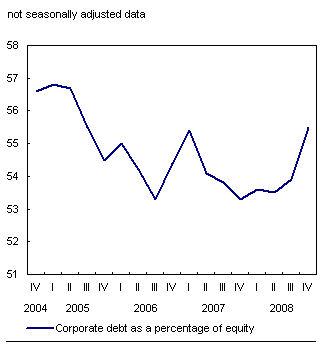
Credit market debt outstanding of non-financial corporations rose 3.6% in the fourth quarter (the largest increase since the second quarter of 1990), principally due to increased bank loans.
Reduced earnings and fewer share issues combined with the increase in borrowing in the fourth quarter led to a substantial increase in the debt-to-equity ratio of non-financial private corporations. Nevertheless, corporate leverage remained at historically low levels.
Chart H.3 Corporate debt as a percentage of equity

Government debt up significantly
The federal government's credit market debt rose by 14% in the fourth quarter of 2008. The increase was led by a record quarterly issuance of treasury bills, which increased the supply of liquid assets to Canadian financial markets. About half of this borrowing was linked to the Insured Mortgage Purchase Program, which financed significant acquisition of mortgage-backed securities. Treasury bill issues met the market demand for liquid investments and also provided funds, deposited at the Bank of Canada, for use in supporting Canadian financial markets.
Other levels of government also increased borrowing in the quarter. The depreciation of the Canadian dollar had the effect of increasing the Canadian dollar value of provincial government liabilities, specifically provincial bonds denominated in US dollars.
Overall, total government net debt (at book value) as a percentage of gross domestic product (GDP) remained flat at 35.5, far below the 92% reached in mid-1996.
Financial institutions' asset composition changes
The Bank of Canada provided significant liquidity during the quarter through the increased use of purchase and resale agreements with financial institutions as well as sales of Treasury bills.
Institutional investors reduced their foreign investment positions in exchange for Canadian short-term paper and bonds. The sharp decline in foreign equity markets also contributed to the reduction in the value of foreign investments.
In addition to the swelling supply of Treasury bills, the fourth quarter of 2008 marked the largest increase ever in National Housing Act mortgage-backed securities outstanding. Lending institutions invested heavily in domestic fixed income securities while net new mortgage and consumer credit lending slowed.
Smaller gains in non-financial assets account for the deceleration in national net worth
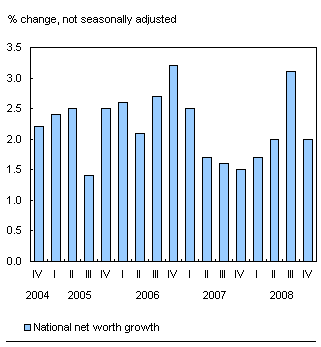
National net worth (total assets less liabilities for all sectors) reached $6.1 trillion, or $182,800 net worth per capita, in the fourth quarter, up from $179,400 in the third quarter of 2008.
However, the growth in national net worth advanced 2.0%, compared with an increase of 3.1% in the previous quarter. The slowdown was due to sluggish non-financial asset growth, which dampened the positive affects of an improved net foreign asset position.
National wealth amounted to just under $6.1 trillion, growing less than 1.0%, a slowdown from the third quarter growth of 2.5%.Chart H.4 Growth in national net worth slows

Net foreign assets rise, led by a substantial depreciation in the Canadian dollar
Canada recorded a net foreign asset position of $50.1 billion (on a market value basis) in the fourth quarter. This resulted largely from a substantial depreciation in the Canadian dollar. Foreign currency-denominated assets, expressed in Canadian dollars, appreciated sharply in the quarter. Canadian direct investment abroad was the major factor behind the increase in Canada's net foreign assets.
The equity market downturn in the fourth quarter resulted in the value of Canadian stocks held by non-residents decreasing more than the value of foreign stocks held by Canadians.
Statistical tables
- Table H.1 National balance sheet accounts
- Table H.2 National balance sheet, market value
- Table H.3 Credit market summary table
Information on methods and data quality available in the Integrated Meta Data Base: 1806.

