Common menu bar links
Gross domestic product by income and by expenditure
Archived Content
Information identified as archived is provided for reference, research or recordkeeping purposes. It is not subject to the Government of Canada Web Standards and has not been altered or updated since it was archived. Please "contact us" to request a format other than those available.
Second quarter 2008
Real gross domestic product (GDP) edged up 0.1% in the second quarter of 2008, following a decline of 0.2% (revised from -0.1%) in the first quarter. While final domestic demand continued to outpace GDP, growing 0.5% in the quarter, foreign demand for Canadian goods and services registered its fourth consecutive quarterly decline.
Consumer and government spending on goods and services advanced. Businesses increased their inventories and reduced their expenditures on fixed capital. Corporate profits grew significantly as prices, particularly for energy products, jumped. The international trade surplus, measured in nominal values, increased as exporters benefited from higher commodity prices. Nonetheless, the volume of exports declined in the quarter.
Export volume continues to fall
The volume of exports of goods and services fell 1.5% in the second quarter, the fourth consecutive decline, leaving their level 4.7% lower than in the second quarter of 2007. The decline in the second quarter of 2008 was widespread as international sales of forestry products, machinery and equipment, and automotive products continued to fall reflecting, in part, declining US expenditures on these goods. The volume of energy exports decreased 3.7% following a jump in the first quarter.
Service exports also fell, after a large drop in the first quarter. Exports of commercial services receded for the second consecutive quarter, and have been on a downward trend since reaching a peak in the fourth quarter of 2005. Exports of travel services registered an increase, after three quarters of decline.
Chart B.1 Exports down again

The volume of imports of goods and services advanced 0.6% after falling 2.3% in the first quarter. After a downturn in the first quarter, machinery and equipment imports grew, continuing the upward trend that began in 2003. The volume of international purchases of energy products jumped, mostly due to increased imports of crude petroleum. Energy imports have posted an average quarterly growth of 9.8% in the first half of 2008.
Imports of industrial goods and materials declined for a second consecutive quarter, reflecting the slowdown in the manufacturing sector. Imports of agricultural and fish products also fell for a second consecutive quarter. Imports of other consumer goods were unchanged, following a drop in the first quarter.
Imports of services declined as a decrease in Canadian travel expenditures abroad (travel services imports) was partially offset by gains in commercial services and transportation.
Personal spending moderates
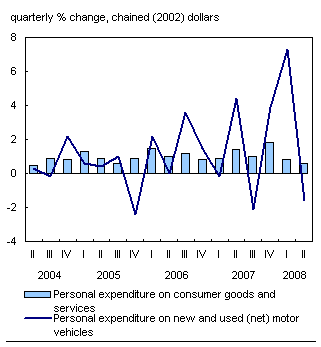
Personal spending grew 0.6% in the second quarter, continuing to moderate after gains of 1.8% and 0.8% in the previous two quarters. The slowdown reflects the drop in spending on durable goods. Notably, purchases of motor vehicles declined after substantial increases in the previous two quarters.
Chart B.2 Personal spending on motor vehicles dips

Spending on non-durable goods was similar to the previous quarter. Households reduced their food and non-alcoholic beverage and energy consumption, as prices for these commodities grew strongly.
Conversely, purchases of clothing and footwear remained strong. Personal expenditure on furniture, furnishings and household equipment posted a sixth consecutive quarterly increase of over 1%.
Spending on services picked up with financial and legal services and restaurants and accommodation services contributing the most. Personal expenditures of Canadian residents abroad registered a small decline, but were still 25% higher than the first quarter of 2007, due to the strong increase in foreign travel that occurred in the last three quarters of 2007.
Housing investment declines
Business investment in residential construction declined 1.0%, following a 1.7% drop in the first quarter.
The downturn in the second quarter affected all areas of housing investment. Renovation activity posted its first quarterly decline since the third quarter of 1999, as home building material stores registered weaker sales. The value of new housing construction declined for a second consecutive quarter. Ownership transfer costs, reflecting housing resales, also declined but at a much slower rate than in the previous three quarters.
Businesses reduce investment in plant and equipment
Business investment in plant and equipment declined 0.4% in the second quarter. Engineering construction increased 0.2% whereas capital spending on non-residential buildings dropped by 1.9%.
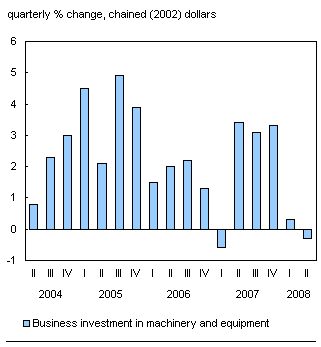
Investment in machinery and equipment was down 0.3%. Businesses reduced their expenditures on automobiles, trucks and other transportation equipment. However, increases were recorded in agricultural machinery, industrial machinery, telecommunications equipment, and other machinery and equipment.
Chart B.3 Machinery and equipment investment declines

Inventories accumulate
Inventory accumulation picked up after easing in the first quarter. Businesses have been accumulating inventories since the third quarter of 2004. Manufacturing inventories were built up after a reduction in the first quarter. Retailers reduced their stocks, particularly of motor vehicles. Other non-farm inventories, particularly natural gas, also accumulated.
The economy-wide inventory-to-sales ratio edged up to 0.694, leaving sufficient inventories to satisfy 63 days of sales.
Corporate profits strengthen
Corporations recorded a significant profit increase in the second quarter (+8.3%), spurred by price increases, particularly for crude petroleum, natural gas and coal. This was the strongest gain in profits since the first quarter of 2004. While non-financial corporation profits jumped 10%, financial corporations registered a marginal increase.
Chart B.4 Corporate profits advance

In addition, farmers nearly doubled their net income in the second quarter, as grain and oilseed prices continued to increase.
Personal income advances
Labour income advanced 1.1%, as growth in services-producing industries remained strong. Employment was up 0.3% while average hours worked declined.
Personal income growth slowed to 0.6%, from 2.0% in the previous quarter, when large one-time government transfers boosted income. Personal disposable income increased 1.1%. Personal outlays outpaced income growth and the saving rate slipped to 2.8%.
National saving advances
Significant expansion in corporate and government saving contributed to a rise in the national saving rate to 13.1% from 12.4% in the previous two quarters.
Chart B.5 National saving moves upward

Jump in export prices fuels GDP price increase
The price of goods and services produced in Canada, as measured by the chain price index for GDP, increased 2.5% in the second quarter, the largest quarterly gain since the first quarter of 1982. Export prices advanced sharply (+8.2%) providing an income boost for exporters, particularly energy producers. Excluding energy, overall prices advanced 0.7%.
Prices for consumer goods and services advanced 0.8% in the quarter, driven by a 2.2% increase in prices for non-durable goods, such as food and energy.
Import prices increased 4.0% after climbing 3.4% in the first quarter. Businesses paid higher prices for plant and equipment, notably for non-residential structures. The final domestic demand price index increased 0.9%.
Chart B.6 Export prices up significantly

Data tables
- Table B.1 Gross domestic product, income-based, current prices and quarterly percentage change
- Table B.2 Gross domestic product, expenditure-based, current prices and quarterly percentage change
- Table B.3 Real gross domestic product, expenditure-based, quarterly percentage change
- Table B.4 Real gross domestic product, expenditure-based, annualized percentage change
- Table B.5 Contributions to percentage change in real gross domestic product, expenditure-based
- Table B.6 Gross domestic product, implicit chain price indexes
Information on methods and data quality available in the Integrated Meta Data Base: 1901 and 2602.

