
Chart 3
Financial literacy, by educational attainment

Archived Content
Information identified as archived is provided for reference, research or recordkeeping purposes. It is not subject to the Government of Canada Web Standards and has not been altered or updated since it was archived. Please "contact us" to request a format other than those available.
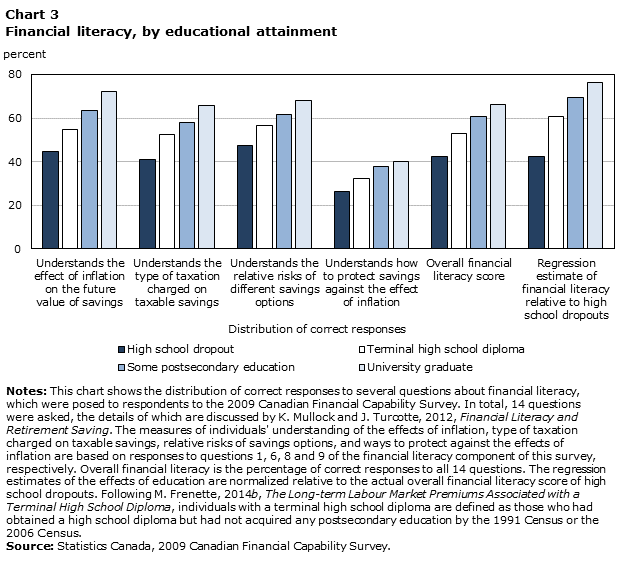
Data table for Chart 3
| Distribution of correct responses | Understands the effect of inflation on the future value of savings | Understands the type of taxation charged on taxable savings | Understands the relative risks of different savings options | Understands how to protect savings against the effect of inflation | Overall financial literacy score | Regression estimate of financial literacy relative to high school dropouts |
|---|---|---|---|---|---|---|
| percent | ||||||
| High school dropout | 44.6 | 40.9 | 47.5 | 26.5 | 42.5 | 42.5 |
| Terminal high school diploma | 54.8 | 52.5 | 56.5 | 32.3 | 52.9 | 60.9 |
| Some postsecondary education | 63.4 | 57.9 | 61.8 | 38.0 | 60.5 | 69.6 |
| University graduate | 72.0 | 65.6 | 67.8 | 40.0 | 66.1 | 76.4 |
|
Notes: This chart shows the distribution of correct responses to several questions about financial literacy, which were posed to respondents to the 2009 Canadian Financial Capability Survey. In total, 14 questions were asked, the details of which are discussed by K. Mullock and J. Turcotte, 2012, Financial Literacy and Retirement Saving. The measures of individuals' understanding of the effects of inflation, type of taxation charged on taxable savings, relative risks of savings options, and ways to protect against the effects of inflation are based on responses to questions 1, 6, 8 and 9 of the financial literacy component of this survey, respectively. Overall financial literacy is the percentage of correct responses to all 14 questions. The regression estimates of the effects of education are normalized relative to the actual overall financial literacy score of high school dropouts. Following M. Frenette, 2014b, The Long-term Labour Market Premiums Associated with a Terminal High School Diploma, individuals with a terminal high school diploma are defined as those who had obtained a high school diploma but had not acquired any postsecondary education by the 1991 Census or the 2006 Census. Source: Statistics Canada, 2009 Canadian Financial Capability Survey. |
||||||
- Date modified: