
The Business & Community Newsletter – February 2019

Archived Content
Information identified as archived is provided for reference, research or recordkeeping purposes. It is not subject to the Government of Canada Web Standards and has not been altered or updated since it was archived. Please "contact us" to request a format other than those available.
Release date: February 22, 2018
Feature article
Tips for navigating the Statistics Canada website
If you've visited Statistics Canada's website recently, you may have noticed a few changes. Because of the volume of data we publish, it can sometimes be hard to figure out where to start. If you are able to, you can join one of Statistics Canada popular webinars, Navigating Statistics Canada's website (watch our Facebook page for announcements). In the meantime, we thought we would give you a few quick tips to help you with your research.
If looking for the latest data, the go to place is The Daily, Statistics Canada's daily news vehicle. You can search any topic here to see the most recent data, and navigate to the appropriate link on the site.
At the top of the home page, there are several options to select to speed up your search, including:
- Subjects: a list of 31 subjects
- Data: to locate tables, community profiles, thematic maps
- Analysis: for Stats in brief, articles, reports, journals and periodicals
- Geography: for info by region or area. Search by city or postal code
- Census: for all things census
There is a lot more to find on our website. If you need any help, you can contact Statistics Canada's Contact Us service.
Rapid Stats Surveys – More than a new name
By André Langdon
In the rapidly evolving world we are living, Statistics Canada is constantly looking at the way it operates, which includes the methodologies used to conduct surveys. One of those methodologies is the appropriately named Rapid Stats methodology - useful for conducting surveys on topical issues with a quick turnaround from collection to publication in a blazing 90 days. This method has recently been used for topical issues in social domains, such as the recent legalization of cannabis and the opioid crisis.
Modern and Relevant
With a larger sample size, shorter questionnaires and simple easy to understand questions, response is improved. Consequently, the responses are easy to process, analyse and it is possible to publish relevant and timely information.
The Rapid Stats surveys represent a modern and relevant alternative to long and detailed surveys. That being said, there is still a place for more elaborate surveys for more complicated topics. While time pressures demand a lot of Canadians, these surveys demonstrate that many do have something to say and are eager to participate. The quick path from collection to publication allows analysts and decision makers to have the relevant data when it is still fresh in the public mindset.
Did you know…?
Who Are the Working Women in Canada's Top 1%?
 Despite notable advancements in educational attainment over the last half century, women continue to be less represented relative to men in top income groups, accounting for one in five workers in the top 1% and one in eight workers in the top 0.1% in 2015. Forthcoming research shows that the underrepresentation of women in top income groups is responsible for an increasingly large share of the gender pay gap. This study addresses an important information gap in the literature by providing a gender-based analysis of the top 1% in terms of socio-economic characteristics, exploring differences in income levels and hours of paid work.
Working women in the top 1% had lower incomes than their male counterparts. On average, working women in the top 1% had a median income of $362,300, compared to $393,200 for their male counterparts. Where women were underrepresented, such as in senior management roles, income gaps were wider, while in health, where women were well represented and salaries are typically influenced by government policies, the gaps were narrower.
Workers in the top 1% are more likely to live in census metropolitan areas (CMAs) than those in the bottom 90%, with slight differences between women and men. Essentially, working women in the top 1% were more likely than their male counterparts to live in CMAs with major financial sectors, such as Toronto and Montreal. Conversely, working men in the top 1% were slightly more likely than their female counterparts to live in resource-based CMAs, such as Calgary and Edmonton.
To access the full article, visit Who Are the Working Women in Canada's Top 1%? in the Analytical Studies Branch Research Paper Series.
Business News
Food services and Drinking Places Sales
This data visualization provides access to data on the sales of food services and drinking places for Canada, provinces and territories. This dynamic application allows users to compare provincial and territorial data with interactive maps and charts. All data in this release are seasonally adjusted and expressed in current dollars.
Visit Food Services and Drinking Places Sales to compare your region with other parts of Canada.
Gender, Diversity and Inclusion Statistics

A focal point for data produced by Statistics Canada's Centre for Gender, Diversity and Inclusion Statistics. Visit the new Gender, Diversity and Inclusion Statistics on the Statistics Canada website.
Data are available on the following topics:
- Business performance and ownership
- Education, training and learning
- Health
- Labour
- Population and demography
- Society and Community
- Crime and justice
- Families and households
- Income, pensions, spending and wealth
- Languages
- Science and technology
- Time use
Regions by the Numbers
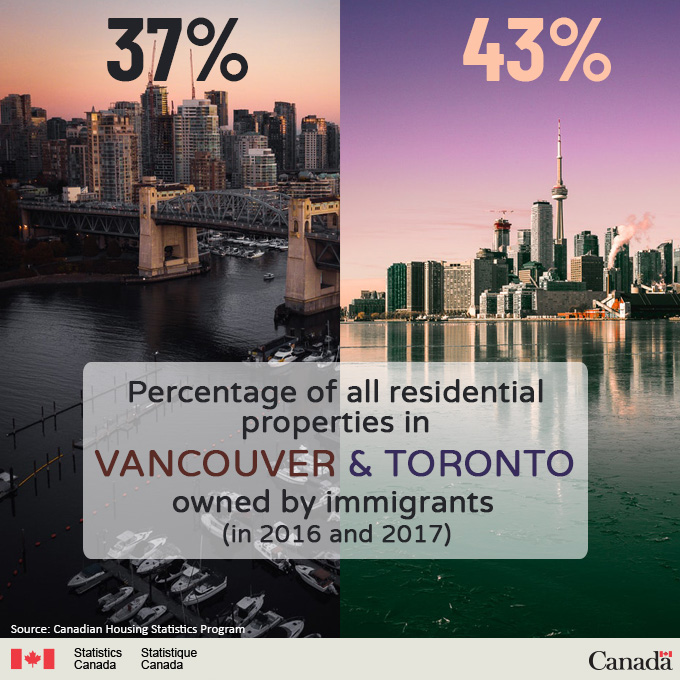
Description - Residential properties in Vancouver and Toronto
Precentage of all residential properties in Vancouver and Toronto owned by immigrants (in 2016 and 2017)
- Vancouver: 37%
- Toronto: 43%
Source: Canadian Housing Statistics Program
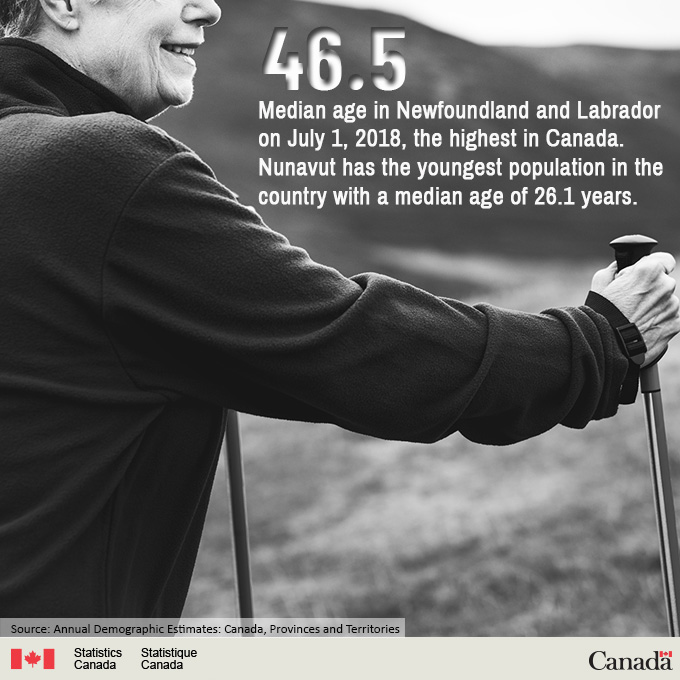
Description - Median age
46.5: Median age in Newfoundland and Labrador on July 1, 2018, the highest in Canada. Nunavut has the youngest population in the country with a median age of 26.1 years.
Source: Annual Demographic Estimates: Canada, Provinces and Territories
Statistics Canada's Workshop Series
Statistics Canada's Workshop Series provides you with direct access to extensive survey methodology and analysis expertise. Below you will find the workshop schedule for your region.
Statistics Canada can also offer dedicated workshops for the members of your organization. If you are interested, please contact us for additional information.
For workshop descriptions, please visit the Workshop series.
| Date | Location and language |
|---|---|
| How to use Census data (1 Day) | |
| March 7, 2019 | Toronto, in English |
| March 13, 2019 | Edmonton, in English |
| March 13, 2019 | Halifax, in English |
| March 14, 2019 | Halifax, in French |
| March 21, 2019 | Toronto, in French |
| March 28, 2019 | Ottawa, in English |
| May 14, 2019 | Montreal, in French |
| May 15, 2019 | Montreal, in English |
| Introduction to the development and design of survey questionnaires (1 Day) | |
| April 9, 2019 | Quebec, in French |
| April 10, 2019 | Quebec, in English |
| May 7, 2019 | Montreal, in French |
| May 8, 2019 | Montreal, in English |
| Turning Statistics into Stories (1 Day) | |
| February 26, 2019 | Edmonton, in English |
| February 27, 2019 | Toronto, in English |
| March 5, 2019 | Ottawa, in French |
| March 19, 2019 | Toronto, in French |
| March 26, 2019 | Ottawa, in English |
| March 27, 2019 | Ottawa, in English |
| April 2, 2019 | Montreal, in French |
| April 3, 2019 | Montreal, in English |
| Introduction to Survey Methods (2 Days) | |
| February 27-28, 2019 | Montreal, in French |
| March 5-6, 2019 | Montreal, in English |
| March 26-27, 2019 | Quebec, in French |
| April 2-3, 2019 | Quebec, in English |
| Statistics Canada's Supply-Use Framework (2 Days) | |
| March 4-5, 2019 | Vancouver, in English |
| May 28-29, 2019 | Montreal, in French |
| May 30-31, 2019 | Montreal, in English |
| Developing Satisfaction Surveys (2 Days) | |
| February 27-28, 2019 | Vancouver, in English |
| Understanding and interpreting data (2 Days) | |
| March 12, 2019 | Edmonton, in English |
| Making Sense of Survey Data (3 Days) | |
| February 26-28, 2019 | Ottawa, in French |
| March 19-21, 2019 | Ottawa, in English |
Also worth reading
Infographic
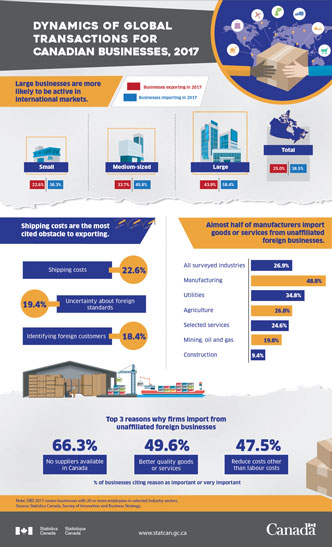
Dynamics of global transactions for Canadian businesses, 2017
This infographic presents results from the Survey of Innovation and Business Strategy relating to the connections of Canadian business to global markets. Data refer to activities in 2017.
Check out the infographic Dynamics of global transactions for Canadian businesses, 2017
Statistics Canada Vision Statement

- Date modified: