
The Business & Community Newsletter – December 2017

Archived Content
Information identified as archived is provided for reference, research or recordkeeping purposes. It is not subject to the Government of Canada Web Standards and has not been altered or updated since it was archived. Please "contact us" to request a format other than those available.
The final set of data from the 2016 Census of Population were released on November 29th. Many people here at Statistics Canada put in an extra effort this year to release the data in record time: 18 months. We want to take this moment to congratulate all our colleagues here at Statistics Canada on a job well-done.
So in this spirit, we are dedicating this month's newsletter to them by featuring information on the fifth and sixth set of 2016 Census data.
Feature articles
Final results from the 2016 Census of Population and launch of a brand-new data visualization tool
On November 15, 2017, Statistics Canada announced the launch of a new statistical dashboard—the Census Program Data Viewer (CPDV). This interactive web-based tool expands on the statistical outputs produced and disseminated by Statistics Canada and presents sociodemographic indicators in an integrated dashboard that incorporates maps, charts, text and tables. The CPDV will enable community stakeholders to easily explore statistical information from the 2016 Census.
Two weeks later, Statistics Canada's census story reached its final chapter. Thanks to the participation of Canadians, the agency was able to provide high-quality information for communities across the country. November 29, 2017, saw the release of the final major instalment from the 2016 Census with data on education, labour, journey to work, language of work, mobility and migration.
The release highlighted what Canadians learn, where they work, how they get there and the language they use in the workplace along with data on mobility and migration. As with all releases, the story of Canada was supplemented with data visualization products, including three interesting infographics.
What's next?
A variety of datasets and products will be published over the next few months. Stay connected by following our official social media accounts on Twitter, Facebook and YouTube.
For more information, please visit the Census Program module on Statistics Canada's website.
Housing in Canada: Key results from the 2016 Census
The housing landscape in Canada has changed over the past decade, against a backdrop of record low interest rates since the 2008-2009 recession, increased construction of condominiums, and rising home prices.
Homeownership rates highest in Atlantic Canada
The Atlantic provinces had the highest homeownership rates in Canada in 2016. Newfoundland and Labrador ranked first with a homeownership rate of 76.7%, well above the national average of 67.8%.
Quebec and the territories had homeownership rates below the national average. Homeownership has historically been low in Quebec, and at 61.3% in 2016, it was the lowest rate among the provinces. Nunavut, at 20.0%, had the lowest rate in the country, among both provinces and territories.
| 2006 | 2016 | |
|---|---|---|
| % | ||
| Canada | 68.4 | 67.8 |
| Newfoundland and Labrador | 78.7 | 76.7 |
| Prince Edward Island | 74.1 | 70.3 |
| Nova Scotia | 72.0 | 68.7 |
| New Brunswick | 75.5 | 74.4 |
| Quebec | 60.1 | 61.3 |
| Ontario | 71.0 | 69.7 |
| Manitoba | 68.9 | 68.7 |
| Saskatchewan | 71.8 | 72.0 |
| Alberta | 73.1 | 72.4 |
| British Columbia | 69.7 | 68.0 |
| Yukon | 63.8 | 63.6 |
| Northwest Territories | 52.9 | 53.7 |
| Nunavut | 22.7 | 20.0 |
Find the latest data on Housing from the 2016 Census.
Immigration and ethnocultural diversity
On Census Day, 21.9% of the population reported they were or had ever been a landed immigrant or permanent resident in Canada. This proportion is close to the 22.3% recorded during the 1921 Census, the highest level since Confederation.
In 2016, Canada had 1,212,075 new immigrants who had arrived in Canada from 2011 to 2016. These recent immigrants represented 3.5% of Canada's total population in 2016.
Since the 1981 Census, Canadians have been able to report all the ethnic and cultural origins of their ancestors themselves, both on their paternal and maternal sides. Up to six origins per person were retained in 2016.
The three following articles are part of the Census in Brief series which provide an overview of key findings from the 2016 Census Program topics.
In the first article, Ethnic and cultural origins of Canadians: Portrait of a rich heritage, census data on ethnic and cultural origins are used to draw a portrait of the richness, diversity and complexity of Canada's cultural heritage today. In 2016, over 250 origins were reported and 41.1% of the Canadian population recorded more than one origin.
Children with an immigrant background: Bridging cultures explains that in some ways, children with an immigrant background help build bridges between adult immigrants who have settled in Canada and the rest of the population. On the one hand, these children, who were born in Canada or immigrated to the country at a young age, learn the values, social norms and official languages of their host country through their school, friends and neighbourhood. On the other, they are familiar with the values and specific cultural practices of their parents' country of origin, not only through their family and cultural community, but also through their own experience in their country of origin.
Therefore, with a dual cultural background, these children grow up, continue studying and eventually join the Canadian labour market.
The final article, Linguistic integration of immigrants and official language populations in Canada, examines the ability of immigrants to speak one of the official languages, considered an important condition for their full participation in Canadian society.
In the 1921 Census of Canada, more than 70% of the foreign-born population reported English or French as a mother tongue, and less than 30% reported another language. In contrast, in the 2016 Census, more than 70% of immigrants reported a language other than English or French as their mother tongue, and less than 30% reported English or French.
For more information on the definitions and concepts, questions and data quality for this release, please visit: Ethnic Origin Reference Guide, Census of Population, 2016, Catalogue no. 98-500-X2016008.
Aboriginal peoples in Canada
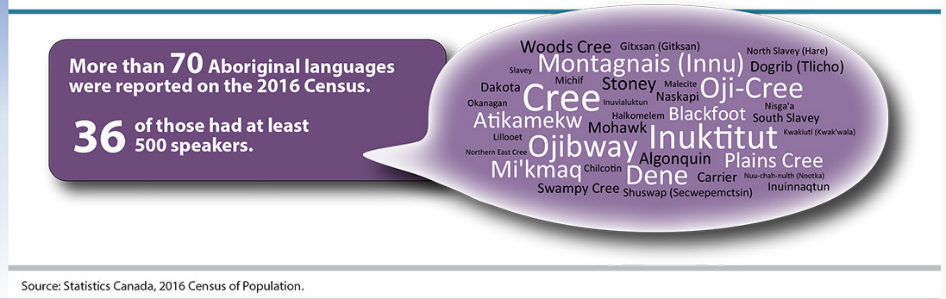
Image description - Aboriginal languages
More than 70 Aboriginal languages were reported on the 2016 Census. 36 of those had at least 500 speakers.
- Woods Cree
- Gitxsan (Gitksan)
- North Slavey (Hare)
- Slavey
- Montagnais (Innu)
- Dogrib (Tlicho)
- Dakota
- Michif
- Stoney
- Malecite
- Oji-Cree
- Nisga'a
- Okanagan
- Cree
- Inuvialuktun
- Naskapi
- Halkomelem
- Blackfoot
- South Slavey
- Atikamekw
- Mohawk
- Inuktitut
- Kwakiuti (Kwak'wala)
- Lillooet
- Northern East Cree
- Ojibway
- Algonquin
- Plains Cree
- Mi'Kmaq
- Chilcotin
- Dene
- Carrier
- Nuu-chah-nulth (Nootka)
- Swampy Cree
- Shuswap (Secwepemctsin)
- Inuinnaqtun
Source: Statistics Canada, 2016 Census of Population
Aboriginal peoples have lived in what is now Canada long before the arrival of the first European settlers. Indeed, the history of Canada would be incomplete without the stories of First Nations people, Métis and Inuit. The same is true of its future.
Past censuses have emphasized two key characteristics of the Aboriginal population: that Aboriginal peoples are both young in age and growing in number. The 2016 Census reaffirmed these trends. New data also reveal both the changing nature and the diversity of the First Nations, Métis and Inuit populations.
Some highlights from the 2016 Census of Population release on Aboriginal peoples, as reported in the October 25, 2017 edition of the Daily:
- In 2016, there were 1,673,785 Aboriginal people in Canada, accounting for 4.9% of the total population. This was up from 3.8% in 2006 and 2.8% in 1996.
- The Métis population (587,545) had the largest increase of any of the groups over the 10-year span, rising 51.2% from 2006 to 2016.
- The First Nations population—including both those who are registered or treaty Indians under the Indian Act and those who are not—grew by 39.3% from 2006 to reach 977,230 people in 2016.
- The Inuit population (65,025) grew by 29.1% from 2006 to 2016.
- While the Aboriginal population is younger than the rest of the population in Canada, it is also aging. In 2006, 4.8% of the Aboriginal population was 65 years of age and older; by 2016, this proportion had risen to 7.3%. According to population projections, the proportion of the First Nations, Métis and Inuit populations 65 years of age and older could more than double by 2036.
- Over half of First Nations people live in the western provinces. The First Nations population was concentrated in the western provinces, with more than half of First Nations people living in British Columbia (17.7%), Alberta (14.0%), Manitoba (13.4%) and Saskatchewan (11.7%). By comparison, 30.3% of the non-Aboriginal population lived in the western provinces.
- First Nations population more than doubles (101.6 %) in Atlantic Canada from 2006 to 2016.
- Ontario has the largest Métis population.
- Nearly two-thirds of Métis live in a metropolitan area. There were eight metropolitan areas with a population of more than 10,000 Métis in 2016: Winnipeg, Edmonton, Vancouver, Calgary, Ottawa–Gatineau, Montréal, Toronto and Saskatoon. Combined, these areas accounted for just over one-third (34.0%) of the entire Métis population.
In addition, three Census in Brief articles provide additional insight on areas of interest about the Aboriginal peoples:
Free Statistics Canada Webinars
Did you know that Statistics Canada offers free webinars on many different topics? Organized by the Statistical Information Services in the regional offices, they are usually no more than an hour and are normally open to everyone across the country who has internet access.
Joining a meeting is really simple, from work or home. All you need is a computer connected to the Internet, and a phone line.
Currently, registration is open for the following:
2016 Census of Population – Labour, Language, Language of work
This webinar will provide you with an overview of the Labour, Language and Language of work data from the long-from census questionnaire, including labour force status, job characteristics, English-French bilingualism, mother tongue, and the use of English, French and other languages at work. Also includes an overview of Language data released in August. This is an introductory webinar. It may be too basic for advanced data users.
2016 Census of Population – Journey to work, Mobility and migration
This webinar will provide you with an overview of the Journey to work and Mobility and migration data from the long-form census questionnaire, including mobility status, components of migration, place of work and journey to work. This is an introductory webinar. It may be too basic for advanced data users.
Important: When registering, please verify that your email address is correct as the system generates an automatic acceptance email. Once we approve your request, you will receive a confirmation email with instructions for joining the session. Registrations cannot be made using a smartphone.
Numbers in Focus
Numbers in Focus - Commuters
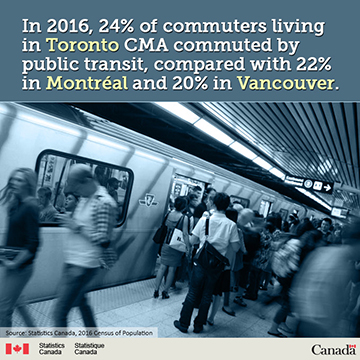
In 2016, 24% of commuters living in Toronto CMA commuted by public transit, compared with 22% in Montréal and 20% in Vancouver.
Source: Statistics Canada, 2016 Census of Population
Numbers in Focus - College graduates
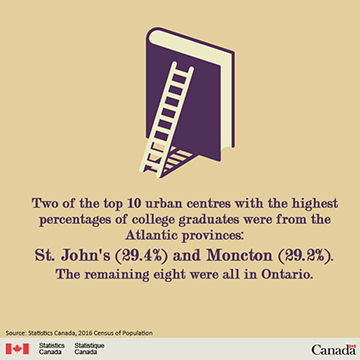
Two of the top 10 urban centres with the highest percentages of college graduates were from the Atlantic provinces:
St. John's (29.4%) and Moncton (29.2%).
The remaining eight were all in Ontario.
Source: Statistics Canada, 2016 Census of Population
Numbers in Focus - Employment rate
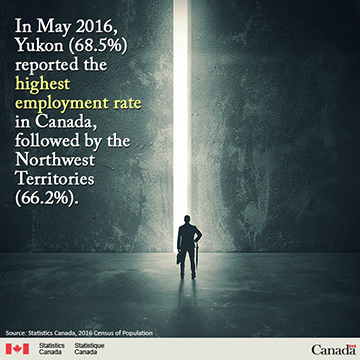
In May 2016, Yukon (68.5%) reported the highest employment rate in Canada, followed by the Northwest Territories (66.2%).
Source: Statistics Canada, 2016 Census of Population
Also worth reading
Infographic – Cyberstalking in Canada
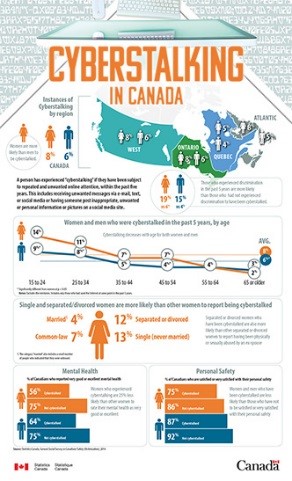 Based on data from the General Social Survey on Canadians' Safety, this infographics looks at instances of cyberstalking in Canada by region, age, sex and marital status.
Health Fact Sheets
Quick facts by census metropolitan area, 2015-2016 features a selection of health indicators for the 34 census metropolitan areas (CMA) in Canada. Data at the provincial and national level is presented and compared with the data for each CMA
By the Numbers…
Christmas…By the numbers
 Here are some facts on assorted topics related to Christmas, the festive season and other religious holidays available at Statistics Canada's “By the numbers” web module.
We would like to take this opportunity to wish you and your loved ones a safe and happy holiday season. See you in 2018!
- Date modified: