The Business & Community Newsletter – June 2015
Archived Content
Information identified as archived is provided for reference, research or recordkeeping purposes. It is not subject to the Government of Canada Web Standards and has not been altered or updated since it was archived. Please "contact us" to request a format other than those available.

Feature articles
Shedding light on the lives of older Canadians
 "Will you still need me; will you still feed me, when I'm 64?" Beatles Paul McCartney who wrote these famous lyrics is now older than 64 and if you were a teenager when that song was released (1966) you probably are too. According to the 2014 Population Estimates, the proportion of seniors in Canada has nearly doubled to close to 16% of the population since 1966.
Based on various growth scenarios of Statistics Canada's most recent demographic projections, seniors could account for about a quarter of the population in 20 years time. This fact has not gone unnoticed by both government and business, and attention is increasingly being focused on this population.
Statistics are not just about numbers. They are also about people and how the country is changing now and in the decades to come.
The first group of baby boomers (born from 1946 to 1965) turned 65 in 2011, and the rest will reach that age over the next fifteen years. By using data from the census and combining them with data from various surveys like the National Household Survey, the General Social Survey and the Labour Force Survey just to name a few, it is possible to get a better picture of life as a senior today and beyond the 21st century.
For example, the article Emerging trends in living arrangements and conjugal unions for current and future seniors (February 2014), reveals some interesting findings. Did you know that about a quarter of seniors who go into a second union choose to live common-law rather than remarry? At Statistics Canada's portal on seniors, you can find many other articles about and of interest to this segment of the population, such as:
- Diversity of grandparents living with grandchildren (Spring 2015)
- Senior Care: Differences by type of housing (February 2015)
- New facts on pension coverage in Canada (December 2014)
- End-of-life care (October 2014)
- Canadians with unmet home care needs (September 2014)
- An overview of the working lives of older baby boomers (October 2014)
- Life expectancy from life tables
This is essential information for any country that aspires to provide for its citizens, young and old alike. Basic demographics are not enough. It's important to know how older Canadians are doing financially, physically and emotionally. Yes, we know that people are living longer but Statistics Canada helps shed light on the nooks and crannies, providing details otherwise unseen.
How's life in the city?
 Can our place of residence affect how good we feel about our life? What are some of the factors that influence our subjective well-being, and how do these vary across major Canadian cities? You will find the answers to some of these questions in the Statistics Canada study, "How's Life in the City? Life Satisfaction Across Census Metropolitan Areas and Economic Regions in Canada".
From 2009 to 2013, most Canadians were generally satisfied with their life as a whole. Residents of the census metropolitan areas (CMAs) of St. John's, Trois-Rivières and Saguenay were, on average, most satisfied with their life as a whole, while those in the CMAs of Vancouver, Toronto and Windsor were least satisfied.
Data from the General Social Survey (GSS) from 2009 to 2013 and the Canadian Community Health Survey (CCHS) from 2009 to 2012 showed average life satisfaction across the country was 8 on a scale of 10 over this period.
By combining GSS and CCHS responses over several years, this study examines the life satisfaction of nearly 340,000 Canadians, making it possible to compare results reliably across CMAs. As well, the study covers the population living outside CMAs, distributed across 58 economic regions across the country.
The underground economy
 In 2012, total underground activity in Canada was $42.4 billion according to "The underground economy in Canada, 2012." This equals about 2.3% of gross domestic product (GDP).
Among other things, these estimates measure phenomena such as ‘skimming’ by businesses, smuggling of tobacco and spirits, rents paid for dwellings rented on the black market, and unreported tips.
The total value of underground economic activity in 2012 was the highest in the four largest economies: Ontario ($15.3 billion), Quebec ($10.4 billion), British Columbia ($5.9 billion) and Alberta ($4.8 billion).
The Faces of Volunteers in Canada
This infographic illustrates data on volunteering in Canada by the age, sex and education level of volunteers, as well as hours volunteered and the volunteering rate.
Data are primarily from the 2013 General Social Survey on Giving, Volunteering and Participating, which was undertaken to better understand how Canadians support individuals and communities on their own or through their involvement with charitable and non-profit organizations.
Infographic: General Social Survey on Giving, Volunteering and Participating
Numbers in focus
Every month we put a couple of interesting numbers in the spotlight!

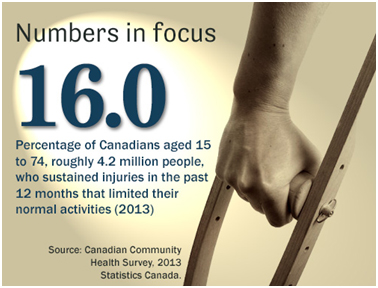
Numbers in Focus - 16.0%
16% of Canadians aged 15 to 74, roughly 4.2 million people, sutained injuries in the past 12 months that limited their normal activities (2013)
Source: Canadian Community Health Survey, 2013 Statistics Canada.

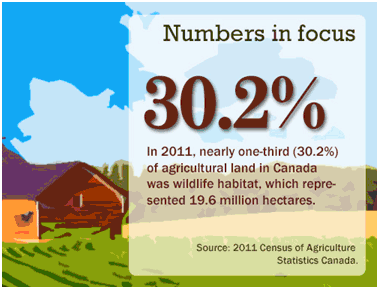
Numbers in Focus - 30.2%
In 2011, nearly one-third (30.2%) of agriculture land in Canada was wildlife habitat, which represented 19.6 million hectares.
Source: 2011 Census of Agriculture Statistics Canada.
5 Questions
So, have you been following the latest data releases? Let's find out. (Please scroll down for answers.)
1. According to the 2009 General Social Survey on Victimization which collected self-reported information on certain types of crime, ___ of residents in the three territories reported that they were victims of at least one criminal incident in the 12 months preceding the survey.
- one tenth
- one fifth
- one third
2. In 2012, the median amount of debt held by Canadian families (expressed in 2012 constant dollars) was ___.
- $30,500
- $60,100
- $75,300
3. Audiometry results from the 2012 and 2013 Canadian Health Measures Survey (CHMS) indicate that ___ of adults aged 19 to 79 years had at least mild hearing loss in at least one ear.
- 10%
- 20%
- 30%
4. According to a recent study, out of all census metropolitan areas, residents of ___ were, on average, the most satisfied with their life as a whole.
- Moncton
- Saskatoon
- Saguenay
5. According to a recent study, out of all census metropolitan areas, residents of ___ were, on average, the least satisfied with their life as a whole.
- Vancouver
- Toronto
- Montreal
Also Worth a Read
Talking INNOVATION in Toronto
 On May 28, 2015, the Chief Statistician of Statistics Canada delivered a presentation in Toronto to highlight the recent results from the Survey of Innovation and Business Strategy 2012, from a national and a provincial perspective. It focused on the four types of innovation as well as how advanced technology use supports innovation. The presentation also addressed the total economy by providing international and provincial comparisons from the recent results of the Gross Domestic Expenditures on Research and Development. It was followed by a panel discussion with experts and audience questions. This event was part of Talking Stats: A discussion series with StatCan, held in different Canadian cities, discussing the uses of statistics in various fields. These half-day events are a wonderful opportunity for Statistics Canada to connect and engage with you, our data users and stakeholders, to better understand your evolving data needs and to gather your feedback.
Canada goes urban

The proportion of Canadians living in a rural area has steadily declined over the past 160 years, falling below the 50% threshold between 1921 and 1931, mainly as a result of economic changes. Following a pause in the 1930s, probably as a result of the Great Depression, the proportion of Canadians living in a rural area continued to decrease from the 1940s to the early 1970s.
Since then, the decline has been less pronounced between censuses. While the number of Canadians living in rural areas has been relatively stable, the population living in population centres has been rising steadily. Consequently, the proportion of Canadians who live in rural areas has fallen.
The proportion of Canadians living in a rural area is the third lowest among the G8 countries following the United Kingdom and the United States. More than 30% of the population of Japan and Italy lived in a rural area in 2010 or 2011, compared with 50% of the population in the emerging economies of South Africa and China and 70% in India.
To learn more about this, see "Canada goes urban" on the Canadian Megatrends page.
Answers to 5 Questions:
1: one third (Source), 2: $60,100(Source), 3: 20% (Source), 4: Saguenay (Source), 5: Vancouver (Source)
- Date modified:
