
Changes in causes of death, 1950 to 2012

Archived Content
Information identified as archived is provided for reference, research or recordkeeping purposes. It is not subject to the Government of Canada Web Standards and has not been altered or updated since it was archived. Please "contact us" to request a format other than those available.

Although death is a universal reality, the conditions or diseases that cause death have changed over time. Today, the leading cause of death is cancer, while 60 years ago—before significant public health interventions—infectious diseases and accidents were more likely to claim the lives of Canadians.
Learning about how the causes of death have changed over time allows for the design and implementation of better public health policies and treatment programs, and for the establishment of more informed research priorities.
Trends in overall mortality from 1950 to 2012
For decades, Canadians have seen sustained increases in longevity. Death rates from all causes combined have been steadily decreasing for both men and women. From 1950 to 2012, the annual death rate for men declined from 1,831.5 deaths per 100,000 men to 843.4, a 53.9% drop. During the same period, the annual rate for women declined even further, from 1,475.6 deaths per 100,000 women to 580.3, a 60.7% drop.
The first half of the 20th century saw several significant public health improvements, including immunization against smallpox and diphtheria, milk pasteurization to prevent bovine tuberculosis, and chlorination to disinfect drinking water. In addition, routine childhood immunization became common during this period. Life-altering scientific discoveries—such as insulin and penicillin—also led to treatments that were more effective for diabetes and infections. The downward trend in death rates from 1950 to 2012 reflects the effects of these public-health interventions, most of which were aimed at reducing deaths from infectious and parasitic diseases. In addition, while maternal mortality (deaths associated with pregnancy and delivery) peaked during the mid-1930s, improvements in pre-natal and post-natal care have had a beneficial effect on the life expectancy of Canadian women.
Trends in mortality by leading causes
By looking at the five leading causes of death from 1950 to 2012, it was apparent which ones were most responsible for the decline in the death rate. Deaths from circulatory system diseases, such as heart disease and stroke, among both men and women dramatically decreased. Among men, the rate of death from circulatory system diseases fell from 998.4 deaths per 100,000 men per year to 236.3, a 76.3% drop. Among women, it fell from 814.1 deaths per 100,000 women per year to 149.7, an 81.6% drop. For men, the rates decreased by an average of 2.3% per year, while for women, it was a 2.7% decrease per year. Declines in deaths from circulatory system diseases accounted for 40% of the gain in life expectancy in Canada from 1951 to 1981, and for about 60% of the gain from 1981 to 2011.
Cancer has become the leading cause of death
Death rates from all types of cancer have not declined as much as the rates for circulatory system diseases. Among Canadian men, death rates due to cancer increased from 1950 to 1988, and then declined by 27.5 % from 1988 to 2012. This trend mainly reflects changes in mortality due to the decline in lung cancer and, to a lesser extent, decreases in deaths from colorectal and prostate cancers.
Among Canadian women, rates of death due to cancer decreased by 17.6% from 1950 to 2012. This decline, however, was interrupted first by a period of slight increases in mortality from the late 1970s to the late 1980s. In general, the increase in mortality was driven by an increase in the death rate from lung cancer, while the declines were driven by the death rates from breast and colorectal cancers.
While diseases of the circulatory system and cancers remain the two leading causes of death, cancer began to claim more lives than diseases of the circulatory system as of 2009 for men, and 2006 for women.
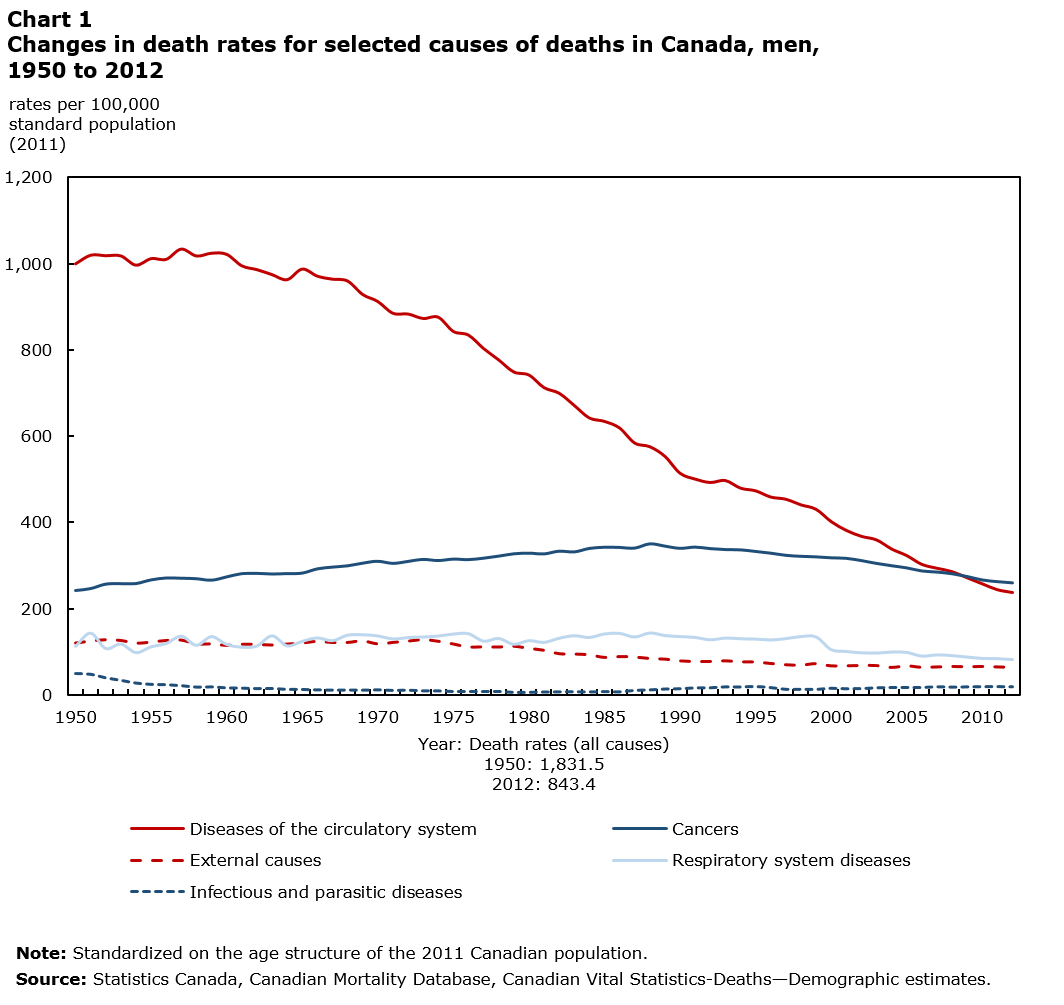
Description for Chart 1
The title of the graph is "Chart 1 Changes in death rates for selected causes of deaths in Canada, men, 1950 to 2012."
This is a line chart.
There are in total 63 categories in the horizontal axis. The vertical axis starts at 0 and ends at 1,200 with ticks every 200 points.
There are 5 series in this graph.
The vertical axis is "rates per 100, 000 standard population (2011)."
The units of the horizontal axis are years from 1950 to 2012.
The title of series 1 is "Diseases of the circulatory system."
The minimum value is 236.3 occurring in 2012.
The maximum value is 1,032.7 occurring in 1957.
The title of series 2 is "Cancers."
The minimum value is 241.0481 occurring in 1950.
The maximum value is 349.4274 occurring in 1988.
The title of series 3 is "External causes."
The minimum value is 64.5735 occurring in 2004.
The maximum value is 127.1118 occurring in 1973.
The title of series 4 is "Respiratory system diseases."
The minimum value is 81.2668 occurring in 2012.
The maximum value is 144.2936 occurring in 1988.
The title of series 5 is "Infectious and parasitic diseases."
The minimum value is 5.9155 occurring in 1979.
The maximum value is 50.1563 occurring in 1950.
| Year | Cancers | Diseases of the circulatory system | Infectious and parasitic diseases | External causes | Respiratory system diseases |
|---|---|---|---|---|---|
| Note: Standardized on the age structure of the Canadian population in 2011. Source: Statistics Canada, Canadian Mortality Database, Canadian Vital Statistics-Deaths, Demographic estimates. |
|||||
| 1950 | 241.0 | 998.4 | 50.2 | 119.5 | 112.7 |
| 1951 | 245.5 | 1018.4 | 48.3 | 124.0 | 143.9 |
| 1952 | 255.9 | 1017.3 | 40.0 | 127.0 | 107.3 |
| 1953 | 257.0 | 1016.8 | 34.2 | 125.3 | 118.1 |
| 1954 | 257.3 | 995.4 | 27.8 | 119.3 | 97.6 |
| 1955 | 265.7 | 1010.5 | 24.8 | 121.8 | 111.4 |
| 1956 | 270.1 | 1008.9 | 24.0 | 125.3 | 119.3 |
| 1957 | 269.6 | 1032.7 | 21.7 | 126.2 | 136.7 |
| 1958 | 268.5 | 1016.6 | 18.3 | 117.7 | 115.1 |
| 1959 | 265.0 | 1023.1 | 18.9 | 117.5 | 135.7 |
| 1960 | 272.7 | 1020.5 | 16.5 | 114.4 | 117.0 |
| 1961 | 280.2 | 993.9 | 15.9 | 116.7 | 110.6 |
| 1962 | 280.8 | 985.0 | 14.8 | 116.6 | 113.3 |
| 1963 | 279.5 | 973.5 | 15.0 | 115.0 | 137.6 |
| 1964 | 280.4 | 961.7 | 13.0 | 117.2 | 113.8 |
| 1965 | 281.5 | 986.3 | 12.8 | 119.6 | 124.3 |
| 1966 | 291.3 | 969.9 | 11.8 | 123.4 | 132.6 |
| 1967 | 295.4 | 962.9 | 11.2 | 120.7 | 125.9 |
| 1968 | 298.4 | 958.6 | 11.4 | 120.8 | 139.0 |
| 1969 | 304.6 | 927.4 | 11.0 | 124.3 | 140.1 |
| 1970 | 309.0 | 911.1 | 11.9 | 117.6 | 137.2 |
| 1971 | 304.1 | 883.9 | 10.4 | 121.0 | 130.2 |
| 1972 | 308.6 | 882.1 | 11.1 | 123.8 | 133.4 |
| 1973 | 313.3 | 871.8 | 9.4 | 127.1 | 134.8 |
| 1974 | 310.6 | 874.7 | 9.4 | 123.5 | 137.0 |
| 1975 | 314.0 | 841.7 | 7.9 | 117.4 | 141.7 |
| 1976 | 312.8 | 833.2 | 7.9 | 110.7 | 142.6 |
| 1977 | 316.2 | 802.1 | 7.9 | 111.1 | 124.9 |
| 1978 | 320.9 | 775.7 | 8.0 | 110.5 | 131.2 |
| 1979 | 326.3 | 747.7 | 5.9 | 112.3 | 117.5 |
| 1980 | 327.8 | 740.6 | 6.1 | 107.5 | 126.0 |
| 1981 | 326.1 | 711.4 | 6.8 | 103.2 | 121.9 |
| 1982 | 332.4 | 698.4 | 7.1 | 95.6 | 131.7 |
| 1983 | 330.7 | 670.1 | 7.5 | 94.6 | 137.8 |
| 1984 | 338.8 | 641.0 | 6.9 | 93.2 | 133.6 |
| 1985 | 341.6 | 633.1 | 7.8 | 87.1 | 142.0 |
| 1986 | 341.1 | 617.7 | 7.2 | 89.1 | 143.4 |
| 1987 | 339.6 | 582.9 | 10.6 | 88.1 | 134.6 |
| 1988 | 349.4 | 574.4 | 11.7 | 84.6 | 144.3 |
| 1989 | 344.2 | 552.0 | 13.8 | 83.3 | 138.2 |
| 1990 | 339.0 | 512.9 | 14.5 | 79.4 | 135.7 |
| 1991 | 341.8 | 499.3 | 16.4 | 77.7 | 133.7 |
| 1992 | 338.4 | 491.4 | 16.6 | 78.1 | 128.1 |
| 1993 | 336.2 | 495.9 | 18.9 | 79.6 | 132.2 |
| 1994 | 335.5 | 478.3 | 18.6 | 77.1 | 130.6 |
| 1995 | 331.8 | 472.1 | 19.7 | 76.9 | 129.8 |
| 1996 | 327.8 | 457.7 | 17.2 | 73.5 | 127.7 |
| 1997 | 322.8 | 452.6 | 13.1 | 70.6 | 130.9 |
| 1998 | 320.5 | 439.5 | 13.2 | 69.7 | 135.8 |
| 1999 | 319.2 | 429.3 | 12.8 | 73.1 | 135.0 |
| 2000 | 317.1 | 400.7 | 15.6 | 68.1 | 104.7 |
| 2001 | 315.8 | 380.3 | 14.3 | 68.2 | 100.4 |
| 2002 | 310.5 | 366.6 | 14.8 | 69.0 | 97.1 |
| 2003 | 304.0 | 358.3 | 16.6 | 68.8 | 96.6 |
| 2004 | 298.6 | 337.2 | 17.3 | 64.6 | 99.0 |
| 2005 | 293.6 | 321.9 | 17.4 | 68.1 | 98.2 |
| 2006 | 286.5 | 301.6 | 17.3 | 64.8 | 89.4 |
| 2007 | 283.9 | 292.6 | 19.1 | 65.8 | 92.3 |
| 2008 | 280.0 | 284.7 | 18.1 | 66.7 | 90.6 |
| 2009 | 273.6 | 270.4 | 18.8 | 66.1 | 87.2 |
| 2010 | 265.5 | 256.4 | 19.3 | 66.8 | 83.9 |
| 2011 | 261.6 | 242.8 | 19.4 | 65.8 | 83.3 |
| 2012 | 258.8 | 236.3 | 18.9 | 64.7 | 81.3 |
Death from intentional and unintentional injuries have been declining over time
From 1950 to 2012, deaths from intentional and unintentional injuries (e.g., accidents, suicides and homicides) declined by 45.9% for men and by 48.2% for women. The downward trend was interrupted during the 1960s and early 1970s by moderate increases in death rates for men, and by a relative stability in death rates for women.
Deaths due to external causes began to decline again two years after the mandatory introduction of seat belts in all new cars in 1971. The decrease in deaths from accidents (unintentional injuries) observed in subsequent years was fostered by various health awareness campaigns (e.g., campaigns against drinking alcohol and driving), as well as by legislation and programs to prevent traffic injury (e.g., mandatory seatbelt use, car seats for children), which contributed to making road trips safer for all, and especially for children and youth. Rates of intentional injuries (suicides and homicides) peaked in 1983, then began to decline among men and became stable among women. Among youth (ages 15 to 19), progress was made in reducing deaths from accidents. However, suicide rates have not changed significantly since 1974 for this age group.
Death rates from respiratory system diseases also fell
From 1950 to 2012, deaths from respiratory system diseases such as asthma, chronic obstructive pulmonary disease (COPD), influenza and pneumonia declined from 112.7 deaths per year per 100,000 men to 81.3, a 27.9% drop. For women, the rate fell from 83.4 deaths per year per 100,000 women to 50.4, a 39.6% drop. In the early 1990s, deaths from these diseases began declining for men following a period of moderate increases. For women, the overall decline from 1950 to 2012 was interrupted by a period of increases in the death rate in the 1980s through the mid-1990s. These increases were mostly driven by an increase in deaths from COPD.
In recent years, the declines in the death rate from respiratory system diseases for men reflect the downward trend in deaths from COPD since the late 1990s, and a long-term downward trend in death rates from influenza and pneumonia. For women, declines in the death rate mainly reflect a long-term downward trend in death rates from influenza and pneumonia, while the death rate from COPD has not fallen.

Description for Chart 2
The title of the graph is "Chart 2 Changes in death rates for selected causes of deaths in Canada, women, 1950 to 2012."
This is a line chart.
There are in total 63 categories in the horizontal axis. The vertical axis starts at 0 and ends at 900 with ticks every 100 points.
There are 5 series in this graph.
The vertical axis is "rates per 100, 000 standard population (2011)."
The units of the horizontal axis are years from 1950 to 2012.
The title of series 1 is "Diseases of the circulatory system."
The minimum value is 149.6705 occurring in 2012.
The maximum value is 822.7154 occurring in 1951.
The title of series 2 is "Cancers."
The minimum value is 183.5375 occurring in 2012.
The maximum value is 224.9408 occurring in 1953.
The title of series 3 is "External causes."
The minimum value is 29.008 occurring in 2001.
The maximum value is 60.6554 occurring in 1950.
The title of series 4 is "Respiratory system diseases."
The minimum value is 46.6627 occurring in 1979.
The maximum value is 113.5552 occurring in 1951.
The title of series 5 is "Infectious and parasitic diseases."
The minimum value is 3.2402 occurring in 1979.
The maximum value is 33.1734 occurring in 1950.
| Year | Cancers | Diseases of the circulatory system | Infectious and parasitic diseases | External causes | Respiratory system diseases |
|---|---|---|---|---|---|
| Note: These rates were standardized on the age structure of the Canadian population in 2011. Source: Statistics Canada, Canadian Mortality Database, Canadian Vital Statistics-Deaths, Demographic estimates. |
|||||
| 1950 | 222.8 | 814.1 | 33.2 | 60.7 | 83.4 |
| 1951 | 224.7 | 822.7 | 30.7 | 58.3 | 113.6 |
| 1952 | 218.6 | 808.9 | 24.1 | 54.1 | 72.8 |
| 1953 | 224.9 | 808.5 | 19.8 | 58.8 | 81.3 |
| 1954 | 223.4 | 772.2 | 15.1 | 55.1 | 68.8 |
| 1955 | 219.4 | 774.6 | 15.2 | 54.8 | 72.3 |
| 1956 | 219.0 | 771.3 | 12.3 | 58.7 | 76.9 |
| 1957 | 219.3 | 773.6 | 11.8 | 54.9 | 84.8 |
| 1958 | 216.7 | 757.4 | 9.4 | 50.4 | 73.1 |
| 1959 | 217.4 | 770.6 | 9.4 | 50.1 | 86.3 |
| 1960 | 216.4 | 748.4 | 8.7 | 51.8 | 69.8 |
| 1961 | 207.8 | 730.7 | 8.2 | 50.0 | 69.2 |
| 1962 | 213.4 | 718.0 | 8.5 | 51.7 | 69.8 |
| 1963 | 213.6 | 711.5 | 6.4 | 50.6 | 81.2 |
| 1964 | 210.5 | 677.4 | 6.1 | 49.4 | 59.7 |
| 1965 | 209.5 | 691.3 | 6.6 | 53.5 | 63.0 |
| 1966 | 205.1 | 673.8 | 5.9 | 50.7 | 68.9 |
| 1967 | 208.1 | 642.2 | 5.4 | 53.4 | 59.0 |
| 1968 | 209.2 | 635.3 | 5.1 | 52.4 | 70.7 |
| 1969 | 208.2 | 616.3 | 6.8 | 51.4 | 65.6 |
| 1970 | 205.3 | 594.9 | 6.8 | 52.0 | 63.9 |
| 1971 | 201.7 | 575.1 | 6.4 | 53.7 | 59.3 |
| 1972 | 206.7 | 572.2 | 6.1 | 54.3 | 61.2 |
| 1973 | 206.2 | 562.0 | 6.3 | 54.0 | 58.8 |
| 1974 | 207.6 | 558.7 | 5.7 | 53.4 | 58.2 |
| 1975 | 200.3 | 533.6 | 5.6 | 52.4 | 59.2 |
| 1976 | 199.7 | 519.0 | 5.3 | 48.4 | 61.4 |
| 1977 | 199.3 | 498.4 | 5.4 | 47.5 | 54.7 |
| 1978 | 200.6 | 482.8 | 4.8 | 46.8 | 51.2 |
| 1979 | 203.8 | 461.8 | 3.2 | 47.2 | 46.7 |
| 1980 | 202.4 | 459.8 | 4.0 | 45.1 | 50.7 |
| 1981 | 202.5 | 437.4 | 4.2 | 42.3 | 47.3 |
| 1982 | 202.6 | 431.5 | 4.6 | 39.3 | 54.1 |
| 1983 | 202.8 | 410.0 | 4.7 | 38.7 | 58.8 |
| 1984 | 206.6 | 397.3 | 4.8 | 38.6 | 53.5 |
| 1985 | 210.9 | 386.9 | 4.6 | 36.4 | 57.9 |
| 1986 | 211.1 | 383.0 | 5.1 | 38.3 | 61.9 |
| 1987 | 210.2 | 361.7 | 5.3 | 37.6 | 57.3 |
| 1988 | 211.9 | 356.1 | 5.6 | 35.2 | 62.0 |
| 1989 | 209.6 | 342.1 | 5.5 | 35.4 | 63.6 |
| 1990 | 209.6 | 324.1 | 5.6 | 32.9 | 61.6 |
| 1991 | 210.5 | 317.8 | 6.2 | 32.3 | 61.5 |
| 1992 | 209.4 | 307.3 | 6.0 | 32.2 | 60.1 |
| 1993 | 212.0 | 310.2 | 6.7 | 33.3 | 65.2 |
| 1994 | 213.0 | 303.7 | 6.7 | 31.9 | 64.5 |
| 1995 | 208.7 | 297.8 | 7.5 | 32.7 | 65.9 |
| 1996 | 212.5 | 290.9 | 7.4 | 31.7 | 65.2 |
| 1997 | 206.1 | 288.5 | 7.4 | 31.3 | 68.3 |
| 1998 | 208.0 | 277.3 | 7.8 | 30.1 | 73.4 |
| 1999 | 206.4 | 268.8 | 7.9 | 31.1 | 72.1 |
| 2000 | 207.5 | 255.4 | 9.3 | 29.6 | 56.0 |
| 2001 | 205.4 | 244.7 | 9.3 | 29.0 | 54.3 |
| 2002 | 207.1 | 236.5 | 9.9 | 30.8 | 53.7 |
| 2003 | 205.4 | 225.3 | 10.2 | 30.9 | 54.8 |
| 2004 | 203.2 | 215.8 | 11.8 | 29.8 | 56.8 |
| 2005 | 198.9 | 207.2 | 11.9 | 30.0 | 58.5 |
| 2006 | 195.8 | 190.2 | 11.7 | 30.0 | 52.1 |
| 2007 | 195.5 | 187.1 | 12.3 | 29.8 | 54.6 |
| 2008 | 193.3 | 181.2 | 12.5 | 30.6 | 53.1 |
| 2009 | 189.5 | 172.1 | 13.2 | 30.2 | 54.0 |
| 2010 | 187.9 | 164.2 | 13.4 | 31.5 | 50.3 |
| 2011 | 185.0 | 155.4 | 14.4 | 30.9 | 53.3 |
| 2012 | 183.5 | 149.7 | 14.3 | 31.4 | 50.4 |
Death rates from infectious and parasitic diseases on the rise in recent years
Among all Canadians, from 1950 to 2012, the rate of death from infectious and parasitic diseases (e.g., measles and polio) declined. Among men, the annual rate fell from 50.2 deaths per 100,000 men to 18.9. A closer look at what happened during those years indicates that this downward trend for men was interrupted by a moderate increase in the death rate from the early 1980s to the early 1990s. The death rate then decreased sharply until the late 1990s, and then began a slight upward trend. Among women, deaths from infectious and parasitic diseases also decreased, from 33.2 deaths per year per 100,000 women to 14.3, a decline of 57.0%. Death rates for women have been consistently increasing since 1979, partly the result of continued increases in deaths from COPD.
The resurgence of previously controlled diseases (e.g., outbreaks of invasive meningococcal diseases), and the introduction of new infections (Human Immunodeficiency virus (HIV) infections and severe acute respiratory syndrome (SARS)) may explain the upward trend in death rate from infectious and parasitic diseases for both men and women in recent years.
The declines in rates of death from infectious and parasitic diseases observed in the early 1960s can be partly attributed to the introduction of the measles vaccine. Of the five groups examined in this study, infectious and parasitic diseases was the only group of leading causes of death that have not been declining for both men and women since the mid-1990s.
Several public health developments, such as improved detection, treatment and management of chronic diseases, underlie the changes in the main causes of death observed throughout the second half of the 20th century. The development of new approaches to health promotion, community advocacy and the use of legislation have also contributed to improvements in life expectancy. Other developments that extend life and reduce the burden of diseases continue in the 21st century.
Although infectious and parasitic diseases were the dominant causes of death during the first half of the 20th century, Canada experienced a major shift in this regard. In more recent times, chronic diseases and injuries replaced infectious and parasitic diseases as the main causes of death.
As Canada gained control over infectious and parasitic diseases—the predominant causes of death among infants and children—it also dramatically reduced the rate of death from external causes, such as accidents—a common cause of death among youth. In addition, better treatment and management of chronic conditions led to a reduction in deaths from these causes among older Canadians and, consequently, a decline in premature deaths among this age group (individuals under age 75). Increases in longevity, along with health challenges that may come with aging, have become Canada's new reality.
Definitions
Death rate or mortality rate: The proportion of deaths in a given population within a specified period (usually one year). The rate is often expressed as a number per 100,000, to facilitate interpretation.
Life expectancy: Average number of years an individual could be expected to live based on current patterns of mortality. This indicator reflects environmental conditions in a country, the health of its people, the quality of care they receive when they are sick, and their living conditions.
References
Bryan S. and T. Navaneelan. 2015. Deaths form Chronic Obstructive Pulmonary Disease in Canada 1950 to 2011. Health at a Glance. Statistics Canada Catalogue no. 82-624-X.
Decady, Y. and L. Greenberg. 2014. Ninety years of change in life expectancy. Health at a Glance. Statistics Canada Catalogue no. 82-624-X.
Nagnur, D. 1986. Longevity and Historical Life Tables: 1921-1981 (Abridged): Canada and Provinces. Statistics Canada Catalogue no. 89-506-X.
Navaneelan, T. and T. Janz. 2011. Cancer in Canada: Focus on Lung, Colorectal, Breast and Prostate. Health at a Glance. Statistics Canada Catalogue no. 82-624-X.
Navaneelan, T. 2012. Suicide rates: An overview. Health at a Glance. Statistics Canada Catalogue no. 82-624-X.
Public Health Agency of Canada. 2008. The Chief Public Health Officer's Report on the State of Public Health in Canada. Available at: Report on the State of Public Health in Canada 2008. Accessed April 11, 2013.
Public Health Agency of Canada. 2012. Injury in Review: Spotlight on Road and Transport Safety. Available at Injury in Review, 2012 Edition: Spotlight on Road and Transport Safety. Accessed November 2, 2015.
Strachan, J. and S. Wadhera. 1993. Selected infant mortality and related statistics, Canada, 1921-1990. Statistics Canada Catalogue no. 82-549-X.
Wilkins, K. 1995. Causes of death: How the sexes differ (PDF version, 61 kb). Health Reports. Vol. 7, No. 2. Statistics Canada Catalogue no. 82-003-X.
Contact information
To enquire about the concepts, methods or data quality of this release, contact Yves Decady (Yves.Decady@canada.ca; 613-851-4016), Health Statistics Division.
- Date modified: