
Agreement with social and democratic values in Canada
Release date: May 30, 2023
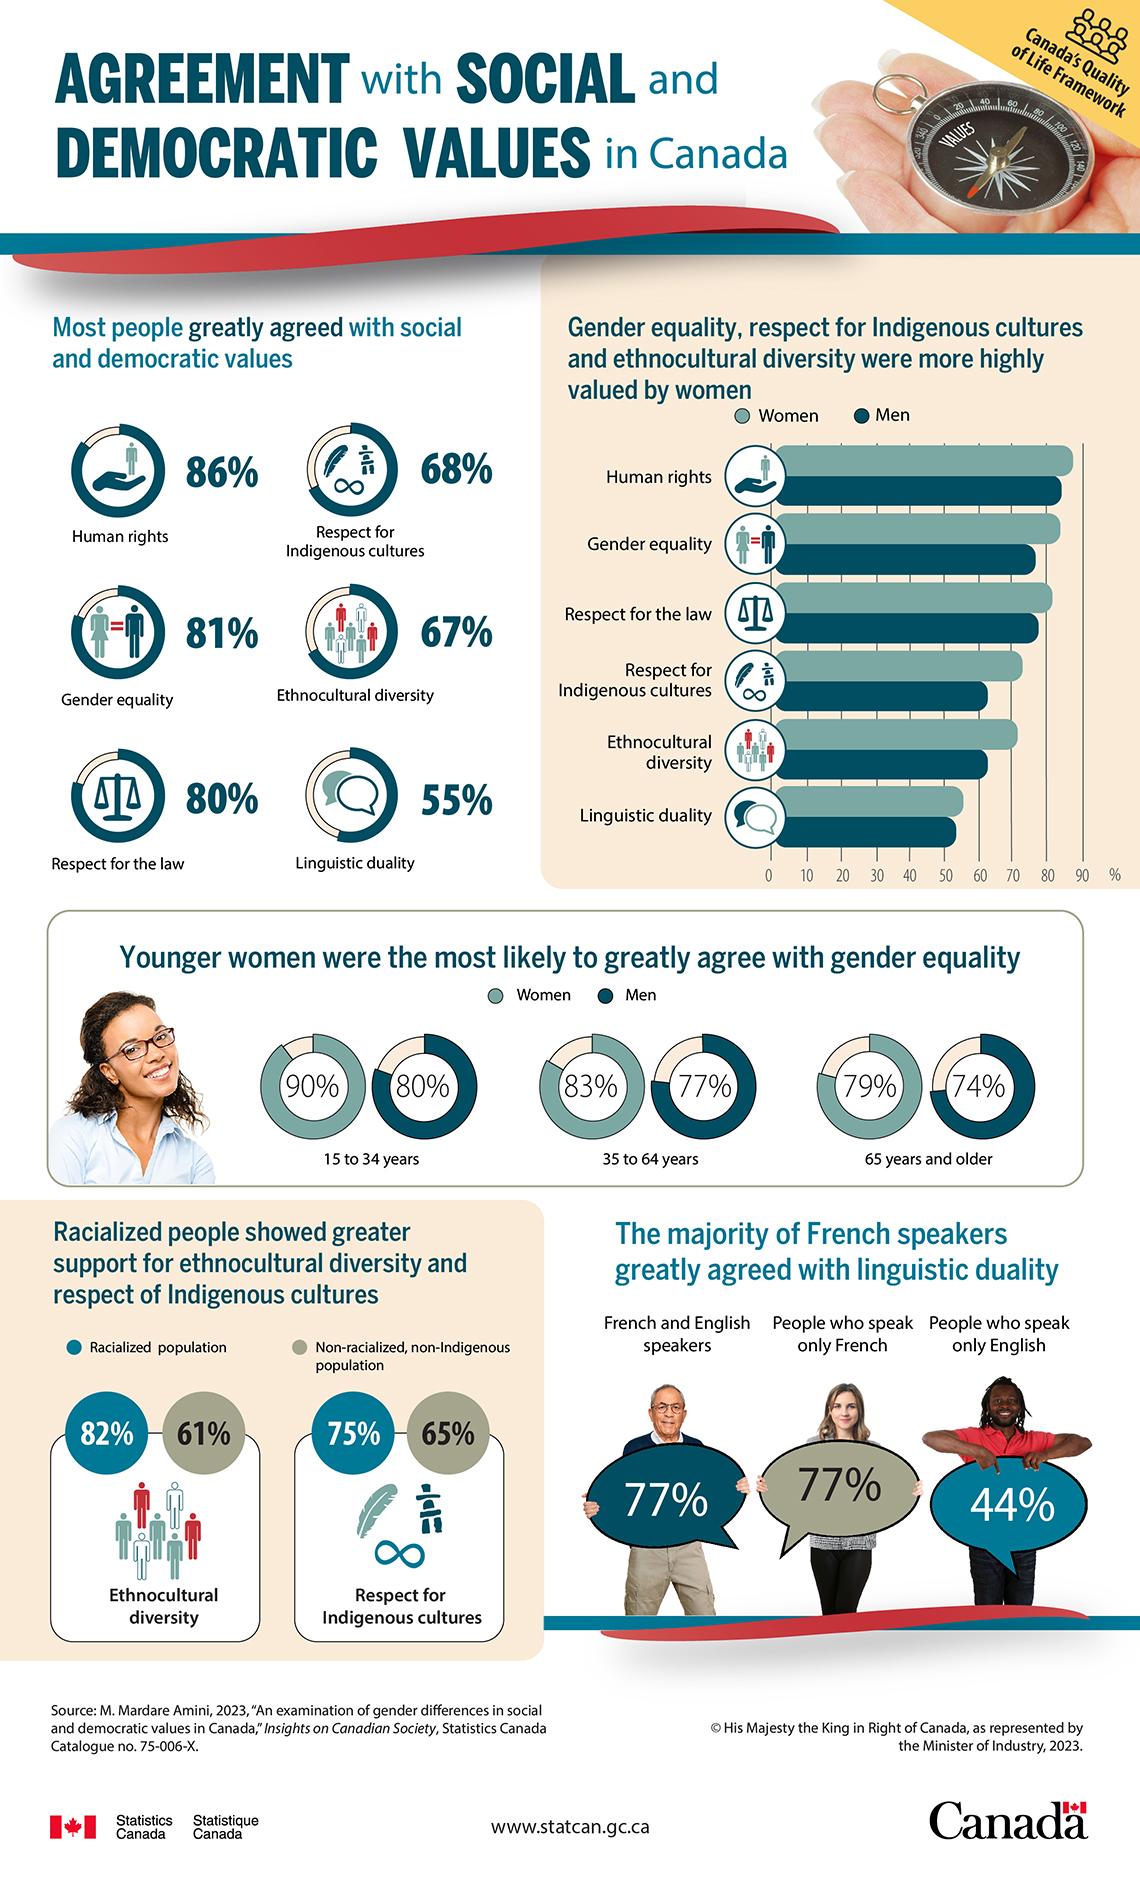
Description: Agreement with social and democratic values in Canada
Most people greatly agreed with social and democratic values.
| Proportion who greatly agreed with each shared value | ||||||
|---|---|---|---|---|---|---|
| Human rights | Gender equality | Respect for the law | Respect for Indigenous cultures | Ethnocultural diversity | Linguistic duality | |
| percentage | ||||||
| Canada | 86 | 81 | 80 | 68 | 67 | 55 |
Gender equality, respect for Indigenous cultures and ethnocultural diversity were more highly valued by women.
| Proportion who greatly agreed with each shared value | ||||||
|---|---|---|---|---|---|---|
| Human rights | Gender equality | Respect for the law | Respect for Indigenous cultures | Ethnocultural diversity | Linguistic duality | |
| percentage | ||||||
| Women | 87 | 84 | 82 | 73 | 71 | 55 |
| Men | 84 | 77 | 79 | 63 | 62 | 54 |
Younger women were the most likely to greatly agree with gender equality.
| Proportion who greatly agreed with gender equality | |||
|---|---|---|---|
| 15 to 34 years | 35 to 64 years | 65 years and older | |
| percentage | |||
| Women | 90 | 83 | 79 |
| Men | 80 | 77 | 74 |
Racialized people showed greater support for ethnocultural diversity and respect for Indigenous cultures.
| Proportion who greatly agreed with each shared value | ||
|---|---|---|
| Ethnocultural diversity | Respect for Indigenous cultures | |
| percentage | ||
| Racialized population | 82 | 75 |
| Non-racialized, non‑Indigenous population | 61 | 65 |
The majority of French speakers greatly agreed with linguistic duality.
| Language spoken | Proportion who greatly agreed with linguistic duality |
|---|---|
| percentage | |
| French and English speakers | 77 |
| People who speak only French | 77 |
| People who speak only English | 44 |
Source: M. Mardare Amini, 2023, “An examination of gender differences in values in Canada,” Insights on Canadian Society, Statistics Canada Catalogue no. 75-006-X.
Catalogue no.: 11-627-M | ISBN: 978-0-660-48727-4 © His Majesty the King in Right of Canada, as represented by the Minister of Industry, 2023.
- Date modified: