
Beneficiaries of federal business innovation and growth support programs, 2019

Archived Content
Information identified as archived is provided for reference, research or recordkeeping purposes. It is not subject to the Government of Canada Web Standards and has not been altered or updated since it was archived. Please "contact us" to request a format other than those available.
Description: Beneficiaries of federal business innovation and growth support programs, 2019
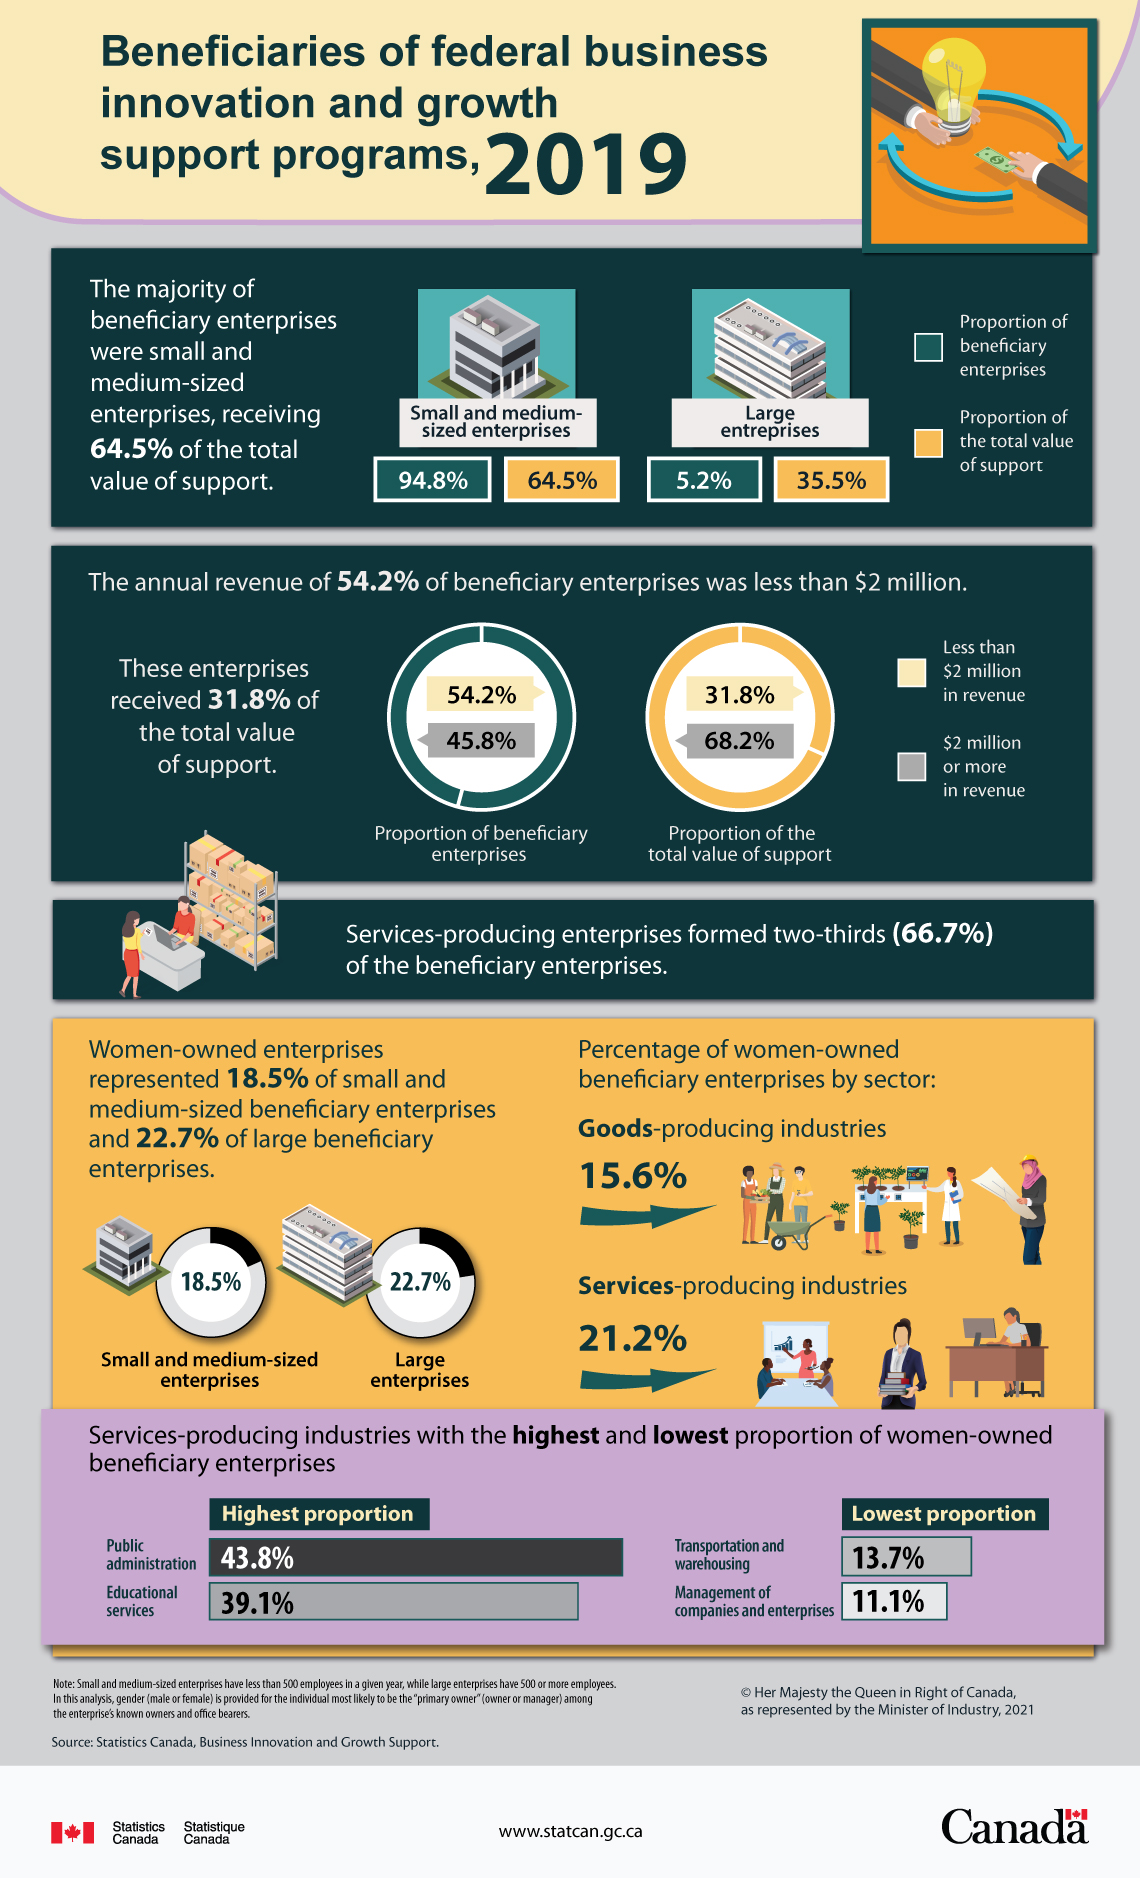
The majority of beneficiary enterprises were small and medium-sized enterprises, receiving 64.5% of the total value of support.
| Employment size | Proportion of beneficiary enterprises | Proportion of the total value of support |
|---|---|---|
| Small and medium-sized enterprises | 94.8% | 64.5% |
| Large enterprises | 5.2% | 35.5% |
The annual revenue of 54.2% of beneficiary enterprises was less than $2 million.
These enterprises received 31.8% of the total value of support.
| Revenue size | Proportion of beneficiary enterprises | Proportion of the total value of support |
|---|---|---|
| Less than $2 million in revenue | 54.2% | 31.8% |
| $2 million or more in revenue | 45.8% | 68.2% |
Services-producing enterprises formed two-thirds (66.7%) of the beneficiary enterprises.
Women-owned enterprises represented 18.5% of small and medium-sized beneficiary enterprises and 22.7% of large beneficiary enterprises.
Percentage of women-owned beneficiary enterprises by sector:
- Goods-producing industries: 15.6%
- Services-producing industries: 21.2%
Services-producing industries with the highest and lowest proportion of women-owned beneficiary enterprises
| Services-producing industries | Proportion of women-owned beneficiary enterprises |
|---|---|
| Public administration | 43.8% |
| Educational services | 39.1% |
| Services-producing industries | Proportion of women-owned beneficiary enterprises |
|---|---|
| Transportation and warehousing | 13.7% |
| Management of companies and enterprises | 11.1% |
Note: Small and medium-sized enterprises have less than 500 employees in a given year, while large enterprises have 500 or more employees. In this analysis, gender (male or female) is provided for the individual most likely to be the “primary owner” (owner or manager) among the enterprise’s known owners and office bearers.
Source: Statistics Canada, Business Innovation and Growth Support.
- Date modified: