
A Canada-U.S. Comparison of Employment and Wages

Archived Content
Information identified as archived is provided for reference, research or recordkeeping purposes. It is not subject to the Government of Canada Web Standards and has not been altered or updated since it was archived. Please "contact us" to request a format other than those available.
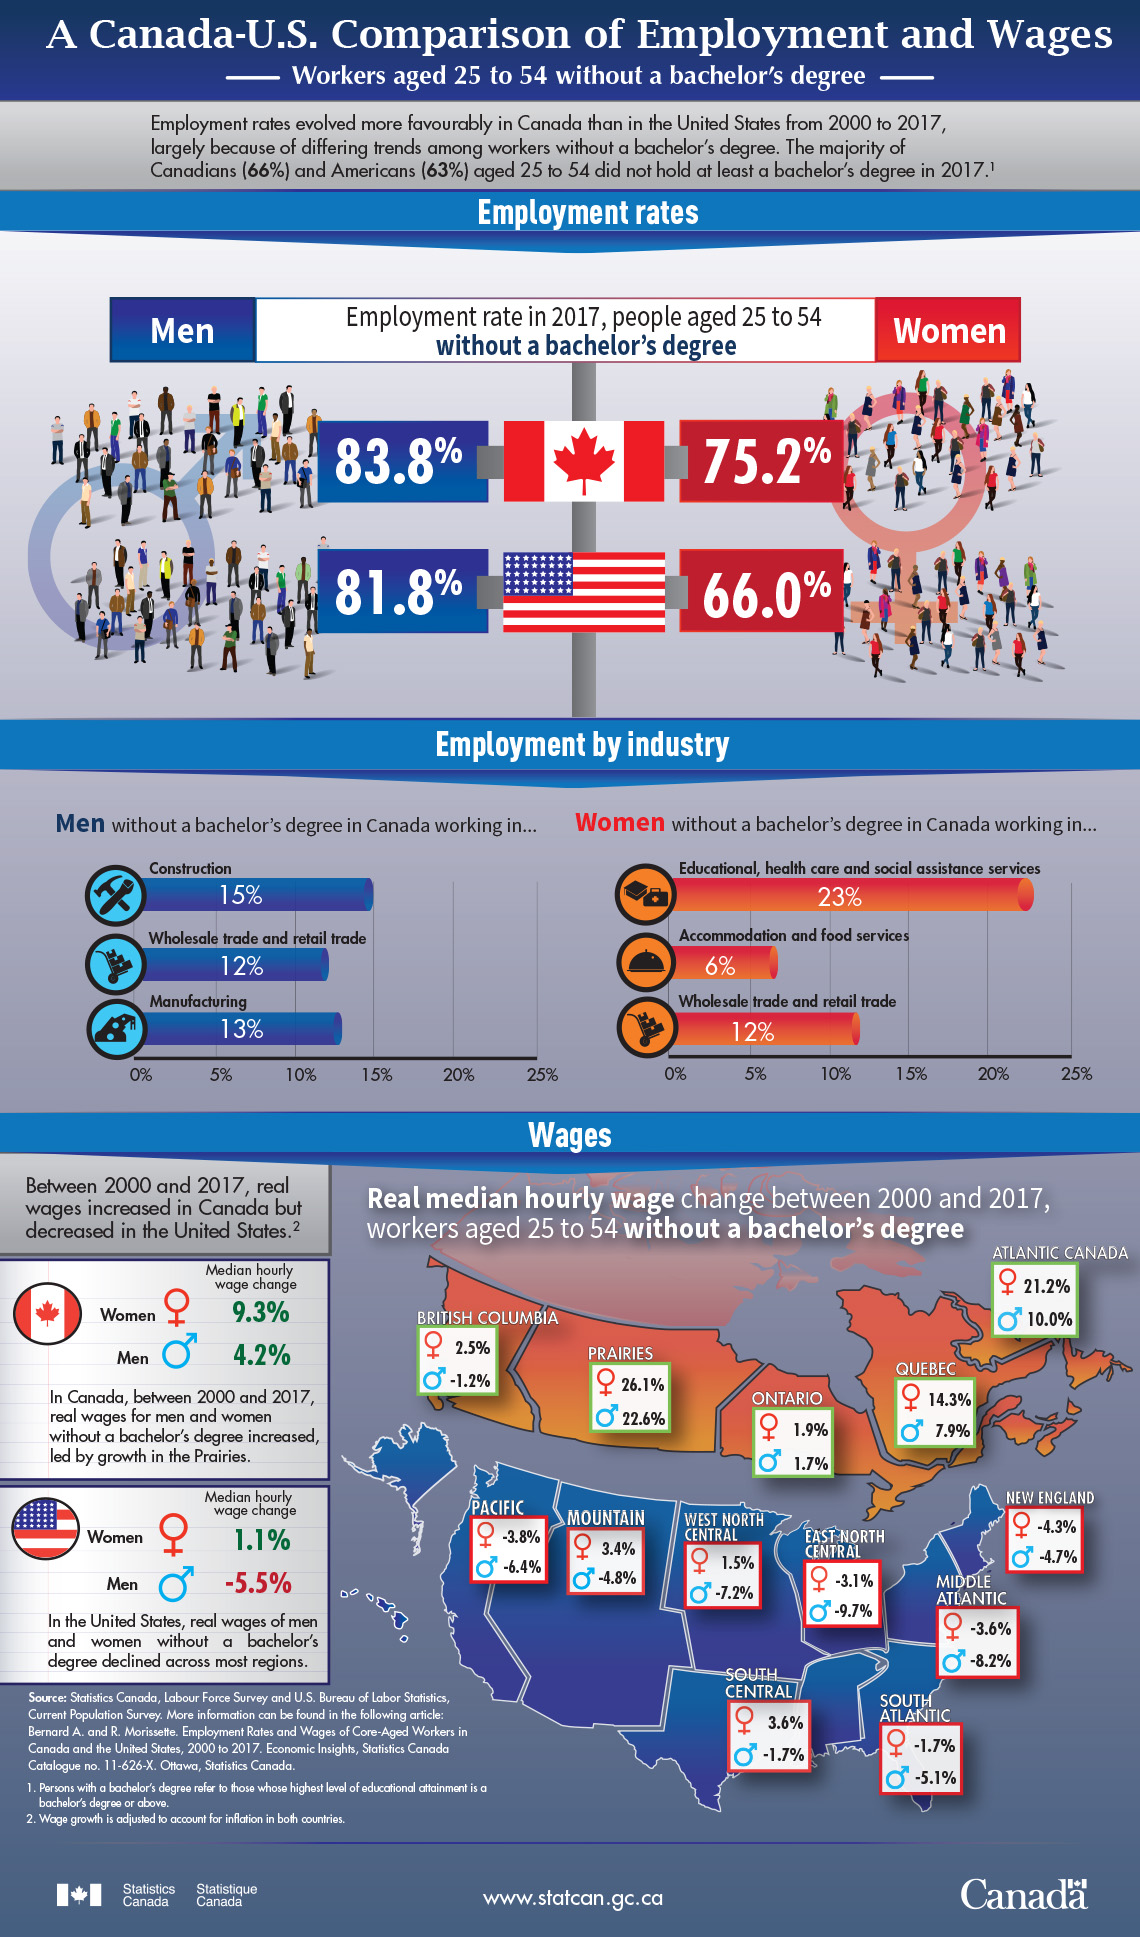
Workers aged 25 to 54 without a bachelor's degree
Description: A Canada-U.S. Comparison of Employment and Wages
Employment rates evolved more favourably in Canada than in the United States from 2000 to 2017, largely because of differing trends among workers without a bachelor's degree. The majority of Canadians (66%) and Americans (63%) aged 25 to 54 did not hold at least a bachelor's degree in 2017.Footnote 1
Employment rates
| Men | Women | |
|---|---|---|
| Canada | 83.8% | 75.2% |
| U.S. | 81.8% | 66.0% |
Employment by industry
Men without a bachelor's degree in Canada working in...
- 15% were employed in construction
- 12% were employed in wholesale trade and retail trade
- 13% were employed in manufacturing
Women without a bachelor's degree in Canada working in...
- 23% were employed in educational, health care and social assistance services
- 6% were employed in accommodation and food services
- 12% were employed in wholesale trade and retail trade
Wages
Between 2000 and 2017, real wages increased in Canada but decreased in the United States.Footnote 2
| Men | Women | |
|---|---|---|
| Canada | 4.2% | 9.3% |
| U.S. | -5.5% | 1.1% |
In Canada, between 2000 and 2017, real wages for men and women without a bachelor's degree increased, led by growth in the Prairies.
In the United States, real wages of men and women without a bachelor's degree declined across most regions.
| Women | Men | |
|---|---|---|
| Canada | ||
| Atlantic Canada | 21.2% | 10.0% |
| Quebec | 14.3% | 7.9% |
| Ontario | 1.9% | 1.7% |
| Prairies | 26.1% | 22.6% |
| British Columbia | 2.5% | -1.2% |
| TOTAL | 9.3% | 4.2% |
| United States | ||
| New England | -4.3% | -4.7% |
| Middle Atlantic | -3.6% | -8.2% |
| East North Central | -3.1% | -9.7% |
| West North Central | 1.5% | -7.2% |
| South Atlantic | -1.7% | -5.1% |
| South Central | 3.6% | -1.7% |
| Mountain | 3.4% | -4.8% |
| Pacific | -3.8% | -6.4% |
| TOTAL | 1.1% | -5.5% |
Source: Statistics Canada, Labour Force Survey and U.S. Bureau of Labor Statistics, Current Population Survey. More information can be found in the following article: Bernard A. and R. Morissette. Employment Rates and Wages of Core-Aged Workers in Canada and the United States, 2000 to 2017. Economic Insights, Statistics Canada, Catalogue no. 11-626-X. Ottawa, Statistics Canada.
- Date modified: