
Statistics Canada
www.statcan.gc.ca
Common menu bar links
Trade

Archived Content
Information identified as archived is provided for reference, research or recordkeeping purposes. It is not subject to the Government of Canada Web Standards and has not been altered or updated since it was archived. Please contact us to request a format other than those available.
Both as workers and consumers, we participate daily in Canadian trade. We drink orange juice from Florida or buy Alberta beef burgers for lunch. We work in fashion retailing or export cars to the United States. Although we have always been a trading people, Canadians today are expanding their networks at home and abroad more than ever before.
Canada has always been active in the international marketplace We export more than we import, and have had a trade surplus every year since 1976. In 2004, Canada exported a total of $429 billion worth of merchandise and imported $363 billion, for a trade surplus of $66 billion.
Contributing most to the trade surplus were energy and forestry products. In 2004, we exported $44 billion more in energy products and $36 billion more in forest products than we imported. The United States was the major destination for both of these product groups.
Trading partners
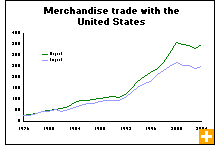
 The United States is Canada’s largest trading partner, and trade between our two neighbouring countries has boomed since the signing of the Canada–U.S. Free Trade Agreement in 1989. More than $550 billion worth of merchandise was traded between Canada and the United States in 2004—an average of $1.5 billion crossing the Canada–U.S. border every day.
Since 1994, exports to the United States have nearly doubled, and imports have climbed 61%. In 2004, we had a record trade surplus with the United States of $139 billion.
China overtook Japan in 2003 to become Canada’s second largest trading partner. In 2004, we imported $24 billion worth of merchandise from China and exported nearly $7 billion. We had a larger trade deficit with China—over $17.4 billion—than with any other country in 2004.
Canada’s trade deficit with Japan decreased to $4.9 billion in 2004, the first time it has dipped below $5 billion since 1997. Fuelled by exports of wood and metals, exports to Japan increased to $8.6 billion as Japan maintained its position as the second largest purchaser of Canadian goods, behind the United States.
With the acceleration of globalization and the expansion of free trade over the past two decades, Canada’s trade has been turning more international than interprovincial. Although the value of interprovincial trade grew by 40% from 1994 to 2004, it was overshadowed by the increase in international trade, which nearly doubled. In 1984, international and interprovincial trade were nearly equal, but by 2004 the volume of international trade was more than twice that of interprovincial trade.
Interprovincial trade
 Trade between the provinces has always been vital to the Canadian economy. In a country as diverse as Canada, provincial trade allows Canadians to benefit from certain provincial specializations—such as wheat from Saskatchewan, beef from Alberta, fish from Atlantic Canada and manufactured goods from Ontario and Quebec.
The only province to have a trade surplus in interprovincial trade in 2004 was Ontario, which recorded a surplus of nearly $25 billion. Ontario’s most valuable domestic export was automotive products, at $82 billion. However, Ontario was also the province least dependent on interprovincial trade, since its trade with other countries—mainly with U.S. border states such as Michigan—was three times larger than its trade with other provinces. Manitoba and Nunavut were the only provinces in 2004 that exported more to other provinces than they exported internationally.
Wholesale trade
Wholesale traders are essentially the middlemen of the trading process, the link between the manufacturer and the marketplace. Wholesale merchants primarily buy merchandise from manufacturers in order to resell it to retailers, other businesses, or other countries.
In 2004, wholesalers sold $450 billion worth of goods, almost double the amount of sales in 1994. Over half of these sales came from Ontario wholesalers. Food product wholesalers had the largest portion of sales, at $78 billion. Sales of motor vehicles placed a close second at $73 billion.
The wholesale gross margin—the return that wholesalers get on their purchases—was 19% in 2003, a slight decline from 1999, when the margin was 21%. The highest gross margins among wholesalers were in office and professional equipment, at 33%, and in apparel, at 32%. Wholesalers of petroleum products, at 7%, and motor vehicles, at 8%, recorded the lowest gross margins in 2003.
Retail trade
 The retail industry is primarily engaged in selling consumer goods and related services to the general public. Retailers come in all shapes and sizes, from large chain stores and car dealerships to small independent stores.
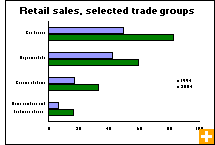
In 2004, the sales of all retail stores totalled $347 billion, an increase of 62% since 1994. The largest amount of sales came from new and used car dealers, which together posted $83 billion of sales in 2004. Over the past 10 years, home centres and hardware stores experienced the largest growth in sales, which more than doubled from 1994 to 2004.
Sales from computer and software stores boomed in the late 1990s, reaching $2.2 billion in 2000, but have tapered off in recent years with 2004 sales totalling $1.6 billion.
The overall gross margin for retailers in 2003 was 26%, a figure that has gone unchanged for five years. Chain stores had a 10% higher gross margin than non-chain stores in 2003. Still, non-chain stores represented the majority of retail sales, with $207 billion in revenue, compared with $150 billion for chain stores.
