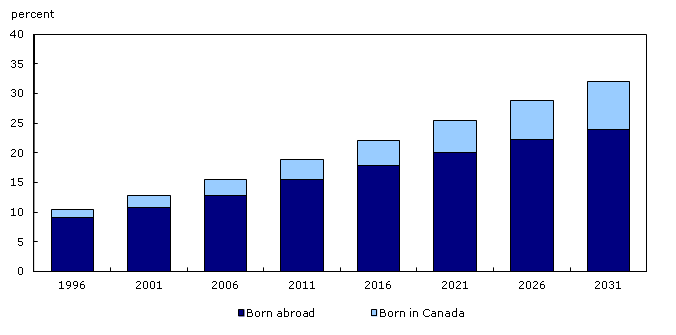
Chart 3.8
Observed (1996 to 2006) and projected (2011 to 2031) proportion of labour force belonging to visible minority groups according to immigrant status, scenario "continuing trends" (C), Canada

Archived Content
Information identified as archived is provided for reference, research or recordkeeping purposes. It is not subject to the Government of Canada Web Standards and has not been altered or updated since it was archived. Please "contact us" to request a format other than those available.
- Date modified: