
1 Data, statistical information and statistics
1.2 Examples of statistical information
Text begins
As you will see, statistical information can be presented in a variety of ways such as texts, tables, visualizations, or infographics.
Quarterly retail sales
An example of statistical information that can be used for decision-making is given below. At Statistics Canada, release of new statistical information on key economic indicators is often done through a short-written communication in The Daily.
In the second quarter of 2019, retail sales in Canada reached $163.3 billion, up 1.4% from the same quarter of 2018. Sales were up in 13 of 19 commodity groupings for the second quarter of 2019.
The largest increase in dollar terms came from food, which posted a year-over-year growth of 3.5%. The majority of this gain was attributable to higher sales of fresh food (+3.4%), led by growth in sales of fresh fruit and vegetables (+5.4%). Sales of packaged food dry goods increased 4.4%, while sales of frozen food grew 1.1%. Sales of soft drinks and alcoholic beverages rose 2.3% from the previous year, largely because of higher sales of alcoholic beverages (+2.6%).
Sales of motor vehicle parts, accessories and supplies grew 5.0% in the second quarter, largely on higher sales of motor vehicle parts and accessories (+6.0%) and new motor vehicle tires (+3.6%).
Meanwhile, sales of motor vehicles also rose 0.6% in the same period as a result of higher sales of used motor vehicles (+6.7%). Receipts for new motor vehicles declined 2.5%, led by lower sales of new passenger automobiles (-14.9%).
Hardware, tools, renovation and lawn and garden product sales were up 1.9% in the second quarter. The largest contributor to the increase was home lawn and garden equipment and supplies (+8.2%).
Sales of automotive and household fuels were down 2.7% compared with the second quarter of 2018. This decline was largely attributable to lower sales of automotive fuels (-2.6%).
Sales of cannabis products in the second quarter of 2019 totalled $251.8 million. Sales of dried cannabis flowering tops were $222.4 million, while sales of cannabis oils were $29.0 million.
Source: Statistics Canada, The Daily, 15/10/2019
1911 Census occupations
This is a table of statistical information about the types of occupations available in Canada in the last century. It shows the number of Canadians who had particular occupations at the time of the 1911 Census. Note how some occupations were referred to at that time!
| Occupation | Males | Females |
|---|---|---|
| Bridge and gate tenders | 436 | 2 |
| Char-workers | 12 | 4,700 |
| Launderers and laundresses | 588 | 282 |
| Hotel keepers | 3,102 | 848 |
| Undertakers | 43 | 0 |
| Gardeners | 469 | 18 |
| Coachmen and grooms | 418 | 0 |
| Sailors and seamen | 16,347 | 0 |
| Match makers | 72 | 178 |
| Nurses | 124 | 5,476 |
| Stenographers and typists | 1,603 | 9,754 |
| Actors and theatrical employees | 2,410 | 432 |
| Musicians and teachers of music | 2,001 | 3,574 |
| Hucksters and peddlers | 3,135 | 113 |
| Total | 30,760 | 25,377 |
| 0 true zero or a value rounded to zero | ||
Population pyramids
Figure 1.2.1 is an example of a dynamic age—sex pyramid of Canadian population projections for 2025, based on an assumption of medium growth. It consists of two horizontal histograms, placed side by side, indicating the number of persons in each single year of age. Men are shown on the left histogram and women are shown on the right, as stated by convention.
View the product Historical Age Pyramid for other years and other projection scenarios.
Age–sex pyramids are commonly used to present statistical information on the age and sex composition of a population. This chart clearly shows the aging "Baby Boomers.”
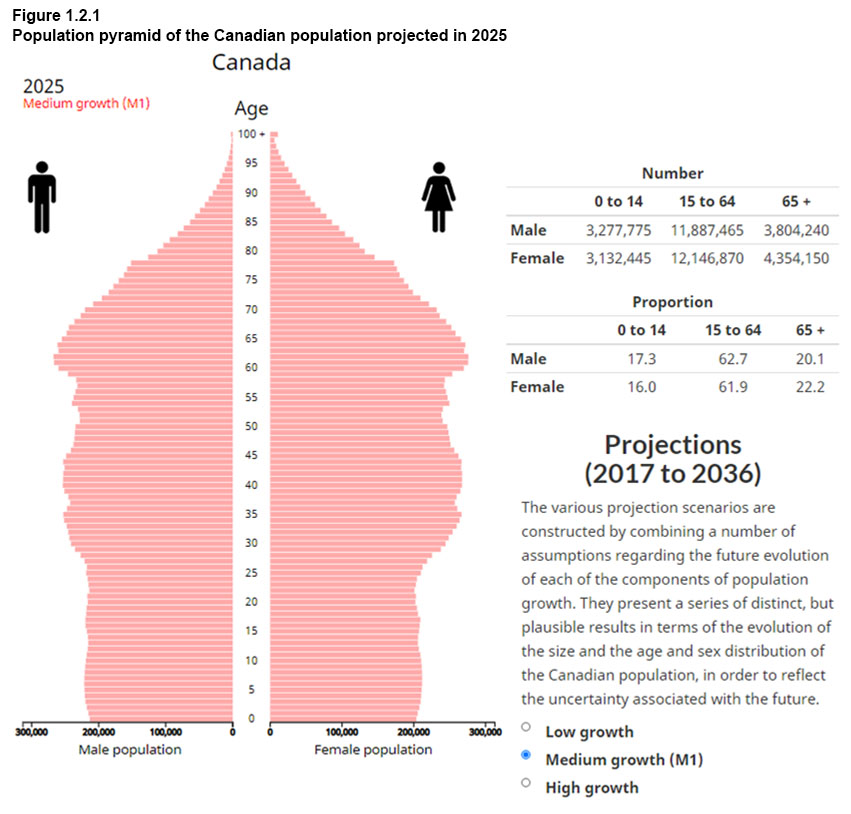
Description for Figure 1.2.1
This figure is a clip from the information product Historical Age Pyramid. The product includes the complete accessible version of the figure.
Infographics
Infographics combine statistics, visualizations (such as graphs or pictographs) and text to communicate a large amount of statistical information in a compact, visually appealing way. Figure 1.2.2 below is a clip from an infographic entitled “150 years of Canadian agriculture.” It consists of a chart showing the time series for the total number of farms and the average acres by farm as well as a table of the total farm sales in 1900 and 2015.
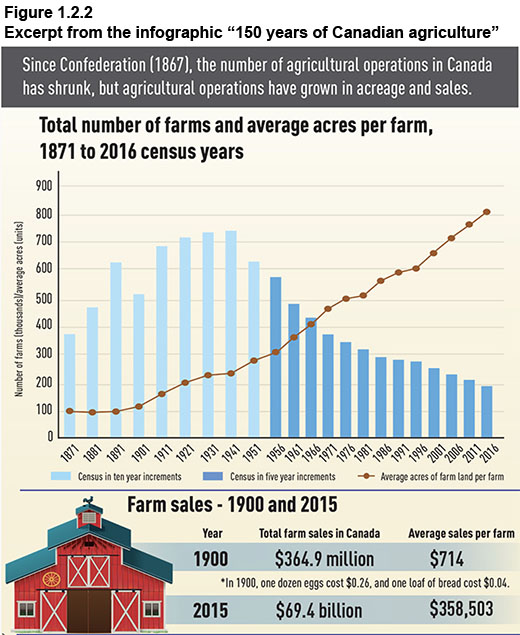
Description for Figure 1.2.2
This figure is a clip from the infography “150 years of Canadian agriculture” that includes the complete accessible version.
- Date modified: