
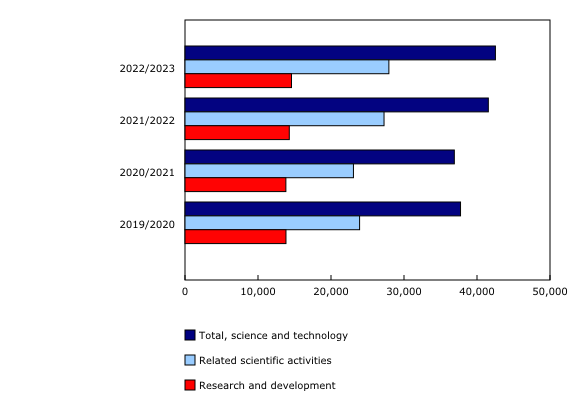
Chart 2
Science and technology personnel by type of activity, 2019/2020 to 2022/2023
Note(s):
Because of rounding, components may not add to the totals.
Source(s):
Table 27-10-0010-01.
Chart description
This is a bar clustered chart.
| Total, science and technology | Related scientific activities | Research and development | |
|---|---|---|---|
| 2022/2023 | 42,520 | 27,930 | 14,590 |
| 2021/2022 | 41,550 | 27,266 | 14,284 |
| 2020/2021 | 36,893 | 23,074 | 13,819 |
| 2019/2020 | 37,746 | 23,915 | 13,831 |
Note(s):
Because of rounding, components may not add to the totals.
Source(s):
Table 27-10-0010-01.
- Date modified: