Gross domestic product by industry, December 2021
Archived Content
Information identified as archived is provided for reference, research or recordkeeping purposes. It is not subject to the Government of Canada Web Standards and has not been altered or updated since it was archived. Please "contact us" to request a format other than those available.
Released: 2022-03-01
December 2021
0.0% 
(monthly change)
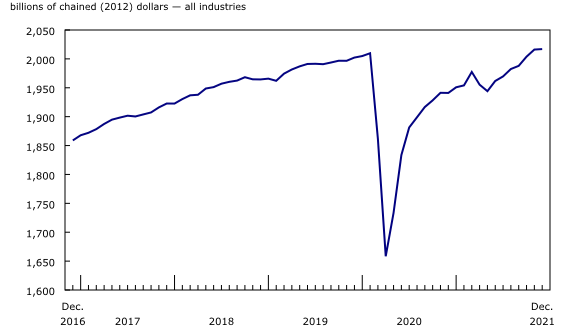
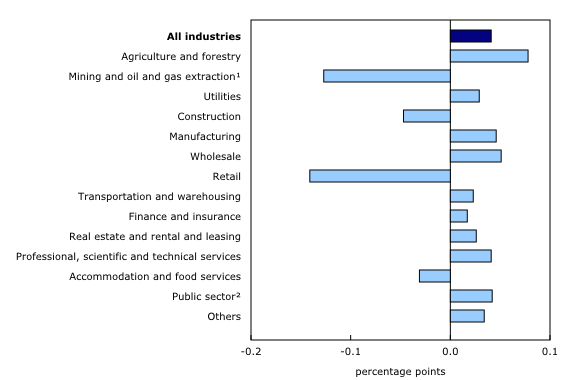
The real gross domestic product (GDP) was essentially unchanged in December following six consecutive months of growth.
Growth in services-producing industries (+0.1%) was offset by a decline in goods-producing industries (-0.1%), as 14 of 20 industrial sectors increased in December.
Advance information indicates a 0.2% increase in real GDP in January, 2022. Leading the growth were retail, construction, finance and insurance as well as the professional, scientific and technical services sector. Notable decreases were in manufacturing, mining, quarrying, and oil and gas extraction as well as client-facing services industries and air transportation services due to continued public health restrictions put in place in late 2021. Owing to its preliminary nature, this estimate will be updated on March 31 with the release of the official GDP data for January 2022.
Spread of Omicron variant stymies some client-facing industries in December
As the Omicron variant of the COVID-19 virus spread through Canada in December, all levels of government reintroduced some level of restrictions in order to slow down its progress. The weight of the Omicron wave was predominantly felt in client-facing industries.
Retail trade declines
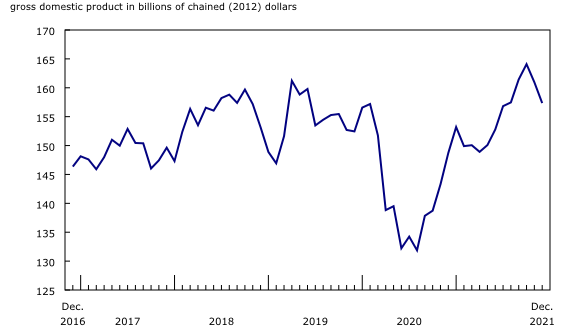
Retail trade declined 2.7% in December, fully offsetting gains observed in the second half of the year. Supply-chain disruptions and the reintroduction of restrictions by various levels of government right before the busiest, last-minute holiday-shopping period, contributed to the largest monthly contraction since May 2021.
Overall, 11 of 12 subsectors contracted with only motor vehicle and parts dealers expanding (+0.6%), led by higher activity at automotive parts, accessories and tire stores. Excluding motor vehicle and parts dealers, retail trade would have decreased 3.3%.
Reduced activity at stores typically associated with holiday shopping accounted for most of the decline in December. Clothing and clothing accessories stores decreased 8.9%, while general merchandise stores were down 1.8%. Food and beverage stores declined 1.0% as scaled-back holiday gatherings partly reduced the demand for goods sold by supermarkets and beer, wine and liquor stores.
In December, building material and garden equipment and supplies (-5.9%) were down for the first time in five months, while activity at furniture and home furnishing stores decreased 11.5%.
Accommodation and food services down in December
Accommodation and food services contracted 1.5% in December, down for the third time in four months, as a result of lower activity at food services and drinking places.
The food services and drinking places subsector decreased 2.4%, with all types of establishments declining in December as capacity limits on restaurants and bars took a bite out of the activity.
Accommodation services rose 0.9% in December, up for the seventh month in a row, but the rate of growth decelerated toward the end of 2021. An increase in traveller accommodation services was partly offset by lower activity at room and boarding houses and recreational vehicle parks and recreational camps.
Arts, entertainment and recreation decline
The arts, entertainment and recreation sector declined 3.7% in December following six months of growth, as both subsectors were down.
Performing arts, spectator sports and related industries and heritage institutions contributed the most to the decline in December with a 5.7% contraction. The number of spectators attending sporting events was down as capacity limits and other indoor restrictions reintroduced in the month affected output. Professional sports leagues in Canada either postponed games or temporarily paused their seasons for virus-related reasons.
Amusement, gambling and recreation industries (-2.3%) contracted for the first time in seven months, as activity at casinos, bingo halls and other amusement and entertainment venues was down partly as a result of the indoor capacity limits reinstated in December.
Mining, quarrying, and oil and gas extraction declines
The mining, quarrying, and oil and gas extraction sector decreased 2.2% in December as all subsectors were down. It was the first back-to-back monthly declines in the sector since March-April of 2020.
Oil and gas extraction decreased 1.9% in December, down for the second month in a row. Oil sands extraction contracted 2.9% in December. Production disruptions at some upgrading and extracting facilities in Alberta contributed to lower crude bitumen and synthetic oil production, and were further exacerbated by the extreme cold that set in over Western Canada. Oil and gas extraction (except oil sands) was down 0.4% as both crude petroleum extraction and natural gas extraction declined.
The mining and quarrying (except oil and gas) subsector fell 3.8% in December as all forms of mining activity were down.
Metal ore mining decreased 3.2% as all industries but one were down. Iron ore mining (-4.6%) and copper, nickel, lead and zinc ore mining (-2.9%) contributed the most to the decline as the international demand for the commodities slowed down in December.
Non-metallic mineral mining was down 2.3%, mainly due to declines in potash mining and diamond mining. Coal mining decreased 11.0%, following an 18.3% decline in November, as exports of coal weakened due to continued logistics disruptions caused by heavy rain, flooding and mudslides in British Columbia.
Support activities for mining, and oil and gas extraction were down 0.5% in December, following seven consecutive months of growth.
Construction declines
The construction sector decreased 0.6% in December, after two months of growth, as most types of construction activity were down.
Residential buildings construction contracted 2.5% in December, down for the first time in three months. Home alterations and improvements contributed the most to the decline. Offsetting some of the decline were increases in apartment-type dwellings construction and single-family homes, up for the first time in eight months.
Non-residential buildings construction edged down 0.1%, the first decline in six months, as lower institutional building construction was offset by upticks in the construction of industrial and commercial buildings.
Following four months of growth, repair construction declined 1.6% in December. Engineering and other construction activities (+2.1%) offset some of the declines, with its seventh consecutive month of expansion.
Wholesale trade keeps growing
The wholesale trade sector grew 0.9% in December, up for the fifth consecutive month. Increases concentrated in three subsectors accounted for all of the growth and more than offset declines in the remaining six subsectors.
The motor vehicle and motor vehicle parts and accessories wholesaling subsector (+6.7%) was up for the third consecutive month, led by higher wholesaling activity of motor vehicles and new motor vehicles parts. The machinery, equipment and supplies subsector rose 1.8%, while the personal and household goods wholesaling subsector increased 1.1%. All three subsectors benefited from higher importing or exporting activity in December of commodities associated with these subsectors.
Manufacturing increases from non-durable industries
Manufacturing rose 0.5% in December, driven by non-durable goods manufacturing. This was the third consecutive monthly increase for the manufacturing sector.
Non-durable goods manufacturing grew 1.0% as six of nine subsectors were up in December. Leading the growth were plastics and rubber products (+6.1%) and chemical manufacturing (+2.5%). Declines in beverage and tobacco (-4.6%) and food manufacturing (-0.4%) offset some of the growth.
Durable goods manufacturing was essentially unchanged in December following two months of growth. Increases in fabricated metal products (+1.9%), non-metallic mineral products manufacturing (+3.0%), and transportation equipment (+1.0%) were offset by decreases in miscellaneous (-7.5%), machinery (-0.7%) and computer and electronic product (-1.4%) manufacturing.
Other industries
Utilities rose 1.4% in December, stemming from higher electric power generation, transmission and distribution (+1.2%) and natural gas distribution (+3.5%). Below seasonal temperatures across many parts of the country, especially in Western Canada, increased demand for heating purposes.
Transportation and warehousing services increased 0.6% in December as 7 of 10 subsectors were up. Air transportation (+10.9%) led the growth as international movements of passengers and goods were up in December.
Fourth quarter 2021
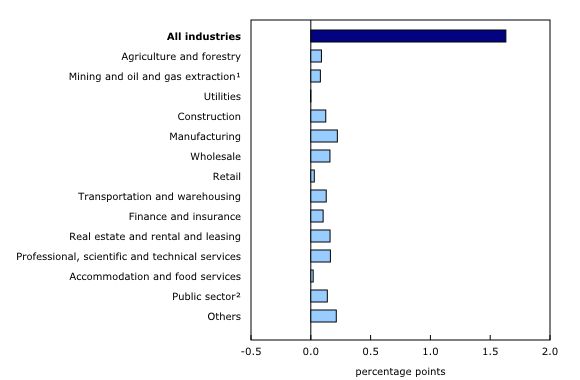
Economic activity continued to grow in the fourth quarter (+1.6%) as value-added output in both services-producing industries (+1.5%) and goods-producing industries (+1.9%) expanded. Despite the onset of Omicron at the end of November, 18 of 20 industrial sectors were up.
Manufacturing expanded 2.3% in the fourth quarter, more than offsetting lower activity recorded in the second quarter. Durable goods manufacturing increased 2.7%, following two quarterly declines, with 8 of the 10 subsectors increasing. Transportation equipment manufacturing (+5.9%) contributed the most to the gain as many motor vehicle assembly and motor vehicle parts facilities restarted production on a more consistent basis in the fourth quarter. Non-durable goods manufacturing increased 1.9% as eight of nine subsectors were up.
Wholesale trade was up 3.0%, the largest quarterly growth rate since the third quarter of 2020, largely offsetting declines in the second and third quarters of 2021 as seven of nine subsectors grew.
The construction sector expanded 1.6% in the final quarter of 2021, offsetting some of the decline recorded in the previous quarter. Engineering and other construction activities (+3.7%) contributed the most to the gain, increasing for a fifth consecutive quarter. Repair construction rose 4.5% in the fourth quarter, recouping most of the ground lost in the previous two quarters, while non-residential building construction was up 1.5%. After reaching an all-time high in the second quarter, residential building construction contracted for a second quarter in a row, declining 1.2% in the fourth quarter. Nevertheless, activity remains well above pre-pandemic levels.
Real estate and rental and leasing (+1.2%) grew for the fifth time in six quarters, buoyed by higher activity at the offices of real estate agents and brokerages, as home resale activity grew across the country.
Professional, scientific and technical services (+2.5%) increased for the sixth consecutive quarter as the majority of industries comprising the sector were up in the final quarter of 2021.
Transportation and warehousing (+3.3%) recorded a second consecutive quarterly increase, led by air transportation (+63.8%) as more domestic and international travellers took to the skies.
Client-facing industries once again contributed to gains in the fourth quarter, supported by the easing of some public health restrictions. Arts and entertainment increased 16.7% in the fourth quarter, with performing arts, sports and heritage institutions (+29.1%) leading the growth in the sector. Amusement, gambling and recreation industries, retail trade and accommodation and food services also increased as restaurants, casinos and other types of establishments were operating at higher capacity.
Finance and insurance (+1.4%) increased for a 10th time in 11 quarters as credit intermediation and monetary authorities (+1.4%) contributed the most to the increase. Financial investment services (+2.4%) saw a volatile market in the fourth quarter with the onset of Omicron, leading to increased activity in bond and equity markets.
Mining, quarrying and oil and gas extraction (+1.4%) grew for the third time in four quarters, led by support activities for mining and oil and gas extraction (+10.7%).
Year 2021
Activity was up in 17 of 20 industrial sectors in 2021 as the economy rebounded (+4.9%) from the sharp contraction recorded in 2020 as a result of the COVID-19 pandemic. Several public health measures were loosened in parts of the year, spurring growth across many industrial sectors. The largest ever recorded annual decline in value-added for services-producing industries observed in 2020 was more than offset by a 5.1% gain in 2021. Goods-producing industries' value added increased 4.3%, offsetting most of the loss recorded in 2020.
The increase in services-producing industries was widespread as many sectors reopened their doors to in-person customers. The public sector (educational services, health care and social assistance, and public administration combined) (+6.4%) contributed the most to the increase, as all components posted gains, driven by health care and social assistance (+9.0%).
Client-facing industries recovered some if not all of the declines recorded in 2020. The retail sector posted a 7.1% gain in 2021, which more than offset the decline recorded in 2020. Accommodation and food services expanded 14.2% in 2021, driven mainly by gains in food services and drinking places (+14.3%). Accommodation was up 13.9% as increases in both domestic and international travel drove demand for lodging. Despite these gains, output for 2021 in the accommodation and food services sector was more than 24% less than in 2019.
Real estate and rental and leasing (+3.4%) continued to grow in 2021 as strong home resale activity in markets across the country pushed activity at the offices of real estate agents and brokers (+23.0%) to the highest level on record. Professional, scientific and technical services expanded 7.0% in 2021 after a 2.7% decline in 2020, as all industries recorded gains.
The mining, quarrying, and oil and gas extraction sector (+8.9%) posted its first annual gain since 2018 and contributed the most to the growth in goods-producing industries in 2021. The metal ore mining industry (+22.2%) was the largest contributor to the increase, followed by oil sand extraction (+7.1%).
After two consecutive annual declines, manufacturing posted a 4.5% gain in 2021. Durable goods manufacturing increased 5.1% as most subsectors expanded. Transportation equipment manufacturing was one of the only subsectors which declined as the motor vehicle and parts manufacturing industry struggled with the global semiconductor chip shortage. Non-durable goods manufacturing rose 4.0% as seven of nine subsectors increased.
Construction expanded 5.9% in 2021 after a 2.1% decline in 2020. Residential buildings construction (+12.9%) was by far the largest contributor to the increase, mainly driven by gains in alterations and improvements and single-family home construction. Even as the subsector retreated in the second half of 2021, total activity in 2021 was still more than 15% higher than in 2019.
The decline in the agriculture, forestry, fishing and hunting sector (-8.1%) partly offset the gains recorded in the goods-producing industries, as record-setting heat, drought and forest fires in Western Canada severely impacted crop production in the year (-15.6%).
Sustainable development goals
On January 1, 2016, the world officially began implementing the 2030 Agenda for Sustainable Development—the United Nations' transformative plan of action that addresses urgent global challenges over the following 15 years. The plan is based on 17 specific sustainable development goals.
The release on gross domestic product by industry is an example of how Statistics Canada supports global sustainable development goal reporting. This release will be used to help measure the following goal:

Note to readers
Monthly data on gross domestic product (GDP) by industry at basic prices are chained volume estimates with 2012 as the reference year. This means that the data for each industry and each aggregate are obtained from a chained volume index multiplied by the industry's value added in 2012. The monthly data are benchmarked to annually chained Fisher volume indexes of GDP obtained from the constant-price supply and use tables (SUTs) up to the latest SUT year (2018).
For the period starting in January 2019, data are derived by chaining a fixed-weight Laspeyres volume index to the prior period. The fixed weights are 2018 industry prices.
This approach makes the monthly GDP by industry data more comparable with expenditure-based GDP data, which are chained quarterly.
All data in this release are seasonally adjusted. For information on seasonal adjustment, see Seasonally adjusted data – Frequently asked questions.
An advance estimate of industrial production for January 2022 is available upon request.
For more information on GDP, see the video "What is Gross Domestic Product (GDP)?"
Revisions
Monthly industry GDP figures, for both the flash and the official estimates, are designed to be very timely and as a consequence are continuously updated as more complete and better information becomes available on the Canadian economy.
Estimates of the Monthly GDP by industry program are subject to different types of revisions. Some involve the availability of source data used in the compilation process, which are routine as more complete and more comprehensive information becomes available, on a monthly, quarterly or annual basis. Other revisions may come from changes to the statistical system, such as survey redesigns, while others can stem from conceptual, classification and definitional changes, as well as methodological changes such as improvements to estimation methods. Finally, assumptions used and standard changes to seasonal adjustment calculations can also contribute to revisions incorporated with each release.
With this release of monthly GDP by industry, revisions have been made back to January 2021 and include revisions stemming from the incorporation of preliminary annual non-residential capital and repair expenditures for the year 2021, updated public sectors estimates as well as revisions across other industrial sectors. Through the above mentioned regular revision activities and data incorporation some individual monthly growth rates have been revised resulting in updated estimates for the second quarter of 2021 from -0.3% to -0.4% and for the third quarter of 2021 from +1.2% to +1.3%.
Real-time table
Real-time table 36-10-0491-01 will be updated on March 14, 2022.
Next release
Data on GDP by industry for January 2022 will be released on March 31, 2022.
Products
The User Guide: Canadian System of Macroeconomic Accounts (13-606-G) is available.
The Methodological Guide: Canadian System of Macroeconomic Accounts (13-607-X) is also available.
The Economic accounts statistics portal, accessible from the Subjects module of the Statistics Canada website, features an up-to-date portrait of national and provincial economies and their structure.
Contact information
For more information, or to enquire about the concepts, methods or data quality of this release, contact us (toll-free 1-800-263-1136; 514-283-8300; infostats@statcan.gc.ca) or Media Relations (statcan.mediahotline-ligneinfomedias.statcan@statcan.gc.ca).
- Date modified:


