Gross domestic product by industry, September 2021
Archived Content
Information identified as archived is provided for reference, research or recordkeeping purposes. It is not subject to the Government of Canada Web Standards and has not been altered or updated since it was archived. Please "contact us" to request a format other than those available.
Released: 2021-11-30
September 2021
0.1% 
(monthly change)
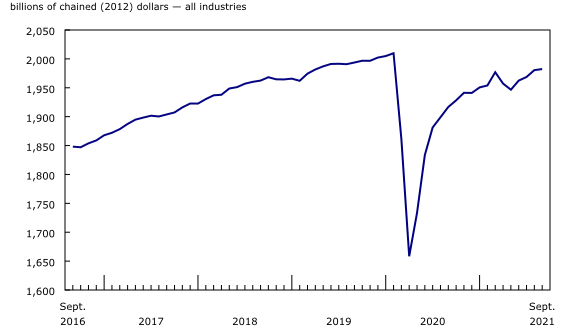
Real gross domestic product (GDP) edged up 0.1% in September, as declines largely concentrated in manufacturing, construction and retail trade were more than offset by broad-based expansions in services-producing industries as well as in mining, quarrying and oil and gas extraction.
Preliminary information indicates that real GDP rebounded in October, up 0.8% with increases in most sectors. Manufacturing led the growth after contracting in September due in part to the effects of the semiconductor shortage. Other notable increases were in public sector, construction, finance and insurance, and transportation and warehousing. Because of its preliminary nature, this estimate will be revised on December 23, with the release of the official GDP data for the October reference month.
Overall, 12 of 20 industrial sectors were up in September, with growth in services-producing industries (+0.4%) more than offsetting a decline in goods-producing industries (-0.6%).
The continued global shortage of semiconductors and other supply chain disruptions markedly affected manufacturing and sales activity at a number of automotive-related industries across different industrial sectors in September.
The effect of the semiconductor shortage pulls down manufacturing activity
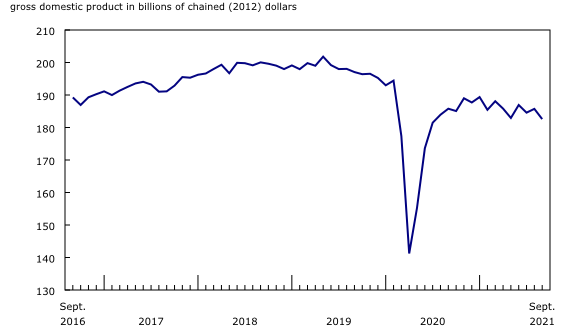
The manufacturing sector declined 1.7% in September, a fifth decline in eight months, as the majority of subsectors contracted.
Durable-goods manufacturing decreased for the fourth time in six months, contracting 2.5% in September, largely as a result of a 9.1% drop in transportation equipment manufacturing. The assembly lines of motor vehicle (-30.8%) and motor vehicle parts (-13.1%) manufacturing curtailed production in response to the ongoing global semiconductor shortage and other supply chain disruptions.
Non-durable goods manufacturing decreased 0.9% in September, following a 1.1% uptick in August. Plastic and rubber products (-7.2%) contributed the most to the decline, due partly to lower demand from motor vehicle and motor vehicle parts manufacturers in the month. Petroleum and coal product manufacturing was down 2.1% in response to a September turnaround at some refining facilities and lower imports of crude oil from the United States where Hurricane Ida disrupted production.
Retail trade contracts following elevated summer
Retail trade decreased 0.9% as 9 of 12 subsectors contracted in September. Activity at clothing and clothing accessories stores fell 6.5%, after a period of elevated activity through the summer months brought on by loosening in-person shopping restrictions and pent-up demand.
Motor vehicle and parts dealers was down for the third consecutive month, decreasing 1.8% in September. Activity at new car dealers continued to decline due in part to lower availability of vehicles for sale resulting from the disruption in global automotive vehicle production.
Public sector continues to grow
The public sector (educational services, health care and social assistance, and public administration) rose 0.6% in September as all three components posted gains.
Public administration was up 1.2%, with federal government public administration (+2.1%) leading the growth. The output of federal government departments' and agencies' services, such as Elections Canada, increased in the month in order to facilitate the federal elections held on September 20.
Local, municipal and regional public administration rose 1.3%, as demand for services increased following easing of restrictions, while Aboriginal public administration (-0.4%) offset some of the growth.
The educational services sector was up 0.6%. Universities (+0.8%), other educational services (+3.8%), and elementary and secondary schools (+0.2%) all recorded growth partly due to students and educators across the country returning to fuller classrooms and lecture halls in September.
Health care and social assistance increased 0.2% as the majority of subsectors were up, led by ambulatory health care services (+0.5%) and social assistance (+0.8%).
Mining, quarrying, and oil and gas extraction continues to grow
Mining, quarrying, and oil and gas extraction grew 1.2% in September, up for the fifth month in a row, as two of three subsectors were up.
The oil and gas extraction subsector grew for the fifth consecutive month, up 2.4% in September. Oil sands extraction rose 2.5% in September as synthetic crude production increased, following the start of a planned maintenance at one of the oil sands upgraders in Alberta. Oil and gas extraction (except oil sands) grew 2.2% as crude petroleum extraction increased, while natural gas extraction was unchanged.
Support activities for mining, and oil and gas extraction grew 1.7% in September, as all types of services were up.
Mining and quarrying (except oil and gas) decreased 1.5% in September. Non-metallic mineral mining fell 4.6% primarily as a result of lower potash mining (-7.0%). Coal mining (-4.9%) decreased for the third time in four months. Metal ore mining increased 0.7%, led by copper, nickel, lead and zinc ore mining (+2.4%) as exports rose; iron ore mining rose 1.9%.
Construction continues to contract
Construction declined 0.7% in September, a fifth consecutive monthly decrease. The monthly decline was driven primarily by the continued contraction in residential building construction, which was down 1.9% in September. All types of residential building construction activity decreased, with home alterations and improvements and single-family homes contributing the most to the contraction.
Non-residential building construction expanded 0.4%, a third consecutive gain, as increased activity in institutional and commercial building construction more than offset lower activity in industrial building and structure construction.
Engineering and other construction activities edged down 0.1%, while repair construction was up 0.2% in September.
Professional, scientific and technical services keep growing
The professional, scientific and technical services sector grew 1.2% in September, up for the fifth consecutive month. Computer systems design and related services led the growth with a 1.2% increase in September, as the industry has been experiencing continuous growth since April 2020. Architectural, engineering and related services (+1.7%), legal services (+1.8%) and other professional, scientific and technical services including scientific research and development (+0.8%) were other notable contributors.
Accounting, tax preparation, bookkeeping and payroll services (-0.1%) was the lone industry to decline in the month.
Other industries
Wholesale trade rose 0.8% in September as gains in machinery, equipment and supplies (+2.5%), miscellaneous (+3.2%), personal and household goods (+1.2%) and food, beverage and tobacco (+0.1%) more than offset declines in the other five subsectors.
Finance and insurance edged up 0.3% in September, up for the fourth consecutive month. Continued gains on interest earned on loans and mortgages pushed the activity at credit intermediation and monetary authorities up 0.6%, more than offsetting declines at financial investment services, funds and other financial vehicles (-0.4%) and insurance carriers and related activities (-0.1%).
Accommodation and food services declined 1.4% in September, following three months of growth. A 3.2% decrease in food services and drinking places more than offset a 4.1% growth in accommodation services; this increase was buoyed by a higher number of international travellers entering Canada following the reopening of the border on September 7 to discretionary travel for fully vaccinated non-residents.
The arts, entertainment and recreation industries grew 5.6% in September following an 8.2% increase in August. All subsectors were up in September, benefiting from continued lifting of capacity restrictions across the country on indoor gatherings and spectator events.
Agriculture, forestry, fishing and hunting declined 1.0% in September as drought conditions continued to severely impact the sector. Crop production (except cannabis) was down 3.1% in September, due to poor harvest quality and quantities. Animal production contracted 1.7% due to higher than normal animal culls in the summer months, brought on by a lack of animal feed from poor crop showings.
Third quarter of 2021
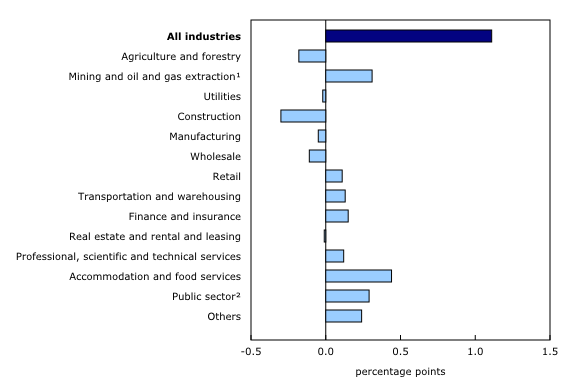
Real GDP resumed growth in the third quarter, following a contraction in the second quarter. Overall, 13 of 20 industrial sectors were up, with gains in services-producing industries (+1.9%) more than offsetting declines in goods-producing industries (-0.9%).
Client-facing industries were among the largest contributors to the quarterly gain, with accommodation and food services (+27.7%) driving the growth. Food services and drinking places rose 27.7%, as public health restrictions on indoor and outdoor dining loosened over the summer and patio capacity expanded. Accommodation services grew 27.7%, driven by gains in traveller accommodation, as increases in both domestic and international travel drove demand for hotel and motel rooms.
The arts, entertainment and recreation sector expanded 22.5%, as all industries in the sector were up, benefiting from the easing of capacity restrictions on large group gatherings over the summer months.
Retail trade expanded 2.1%, the fourth increase in five quarters, despite 7 of its 12 subsectors declining in the third quarter. Clothing and clothing accessory stores (+28.5%), general merchandise stores (+6.0%), furniture and home furnishings stores (+13.3%), gasoline stations (+7.6%) and health and personal care stores (+1.4%) accounted for all the growth in the sector, benefiting from reduced restrictions on in-person shopping.
Mining, quarrying, and oil and gas extraction expanded 5.6%, following a decline in the second quarter, as all three subsectors contributed to the gain. Oil and gas extraction (+5.3%) led the growth as both oil sands extraction (+6.7%) and oil and gas extraction (except oil sands) (+3.5%) were up. Support activities for mining, and oil and gas extraction were up 14.3%, while mining and quarrying (except oil and gas) rose 3.2%.
The educational services sector grew 2.9% as all components were up. Elementary and secondary schools (+2.8%) were the largest contributors to the growth, followed by universities (+2.2%), community colleges and CEGEPs (+3.7%), and other educational services (+7.3%).
Transportation and warehousing expanded 3.3% after two consecutive quarterly declines. Air transportation (+181.9%), which nearly tripled since the first quarter of 2021, was by far the largest contributor to the increase as more domestic and international travellers took to the skies over the summer. However, activity was still approximately one-fifth of its pre-pandemic level. Support activities for transportation (+3.4%) and transit, ground passenger, and scenic and sightseeing transportation (+9.2%) were other notable contributors to growth.
The finance and insurance sector expanded 2.0%, after contracting 0.7% in the second quarter. Credit intermediation and monetary authorities rose 1.8%, driven by banks and other deposit intermediaries. Insurance carriers and related activities (+2.1%) and financial investment services (+2.4%) were also up.
Professional, scientific and technical services expanded 1.8% in the third quarter, up for the fifth quarter in a row, as all industries grew. Leading the growth were computer systems and related services (+1.9%), other professional services including research and development (+2.3%) and architecture, engineering and related services (+2.4%).
The effects of global supply chain disruptions were felt across several segments of the economy within the third quarter.
Construction was the largest impediment to growth, down 3.9% in the third quarter, following four quarters of expansion. Residential building construction fell 8.4% due particularly to decreases in home alterations and improvements and new single-family home construction in the quarter. Still, residential construction activity remains elevated relative to pre-pandemic levels.
Wholesale trade was down 2.0%, as building material and supplies merchant wholesalers (-9.3%) and machinery, equipment and supplies merchant wholesalers (-3.6%) contributed the most to the decline.
The manufacturing sector contracted 0.5% in the third quarter. Durable goods manufacturing decreased 1.9%, as 7 of 10 subsectors were down. Manufacturing of motor vehicles and parts was among the largest contributor to the decline, as the global shortage of semiconductors continued to negatively affect production. Non-durable goods manufacturing expanded 1.0%, as six of its nine subsectors increased.
Agriculture, forestry, fishing and hunting fell 10.0% in the third quarter, a fourth consecutive quarterly decline, mainly due to a significant drop in crop production (except cannabis) (-22.9%) and forestry and logging (-8.5%). A record-setting heat, drought and forest fires in Western Canada severely impacted both subsectors.
Sustainable development goals
On January 1, 2016, the world officially began implementing the 2030 Agenda for Sustainable Development—the United Nations' transformative plan of action that addresses urgent global challenges over the following 15 years. The plan is based on 17 specific sustainable development goals.
The release on gross domestic product by industry is an example of how Statistics Canada supports global sustainable development goal reporting. This release will be used to help measure the following goal:

Note to readers
Monthly data on gross domestic product (GDP) by industry at basic prices are chained volume estimates with 2012 as the reference year. This means that the data for each industry and each aggregate are obtained from a chained volume index multiplied by the industry's value added in 2012. The monthly data are benchmarked to annually chained Fisher volume indexes of GDP obtained from the constant-price supply and use tables (SUTs) up to the latest SUT year (2018).
For the period starting in January 2019, data are derived by chaining a fixed-weight Laspeyres volume index to the prior period. The fixed weights are 2018 industry prices.
This approach makes the monthly GDP by industry data more comparable with expenditure-based GDP data, which are chained quarterly.
All data in this release are seasonally adjusted. For information on seasonal adjustment, see Seasonally adjusted data – Frequently asked questions.
An advance estimate of industrial production for October 2021 is available upon request.
For more information on GDP, see the video "What is Gross Domestic Product (GDP)? "
Revisions
Monthly industry GDP figures, for both the flash and the official estimates, are designed to be very timely and as a consequence are continuously updated as more complete and better information becomes available on the Canadian economy.
Estimates of the monthly GDP by industry program are subject to different types of revisions. Some involve the availability of source data used in the compilation process, which are routine as more complete and more comprehensive information becomes available, on a monthly, quarterly or annual basis. Other revisions may come from changes to the statistical system, such as survey redesigns, while others can stem from conceptual, classification and definitional changes, as well as methodological changes such as improvements to estimation methods. Finally, assumptions used and standard changes to seasonal adjustment calculations can also contribute to revisions incorporated with each release.
With this release of monthly GDP by industry, revisions have been made back to January 2017, in part to incorporate new annual value added benchmark estimates from the latest (2018) supply and use tables. A summary of the main impacts of the revisions to industry GDP figures in 2021 is provided below.
Third quarter of 2021
The initial advanced GDP by industry estimate for the third quarter of 2021 was revised up (from +0.5% to +1.1%) with the official GDP by industry release this month. Revisions were included across several industrial sectors and included the usual receipt of revised prior period data and new, complete data for the month of September and the third quarter. Also contributing to the revised growth estimate for the quarter were lower estimates in the second quarter as described below.
Growth in both July (from -0.1% to +0.3%) and August (from +0.3% to +0.6%) was revised up as a result of the incorporation of new or revised information from data suppliers as well as data confrontation resulting from the availability of the income and expenditure based GDP data.
Revisions were most notable in the manufacturing, finance and insurance, accommodation and food services, education as well as professional, scientific and technical and administrative services sectors.
Second quarter of 2021
In the second quarter of 2021, downward revisions were widespread across several industrial sectors. Revisions were most notable in the manufacturing, finance and insurance, retail, transportation and warehousing, construction and wholesale sectors.
First quarter of 2021
Monthly real GDP estimates in the first quarter of 2021 were revised down primarily as a result of the incorporation of new information for the manufacturing and public sectors.
Real-time table
Real-time table 36-10-0491-01 will be updated on December 13, 2021.
Next release
Data on GDP by industry for October 2021 will be released on December 23, 2021.
Products
The User Guide: Canadian System of Macroeconomic Accounts (13-606-G) is available.
The Methodological Guide: Canadian System of Macroeconomic Accounts (13-607-X) is also available.
The Economic accounts statistics portal, accessible from the Subjects module of the Statistics Canada website, features an up-to-date portrait of national and provincial economies and their structure.
Contact information
For more information, contact us (toll-free 1-800-263-1136; 514-283-8300; infostats@statcan.gc.ca).
To enquire about the concepts, methods or data quality of this release, contact Ederne Victor (statcan.mediahotline-ligneinfomedias.statcan@statcan.gc.ca), Industry Accounts Division.
- Date modified:


