Railway carloadings, September 2021
Archived Content
Information identified as archived is provided for reference, research or recordkeeping purposes. It is not subject to the Government of Canada Web Standards and has not been altered or updated since it was archived. Please "contact us" to request a format other than those available.
Released: 2021-11-29
30.8 million metric tonnes
September 2021
-0.9% 
(12-month change)
Highlights
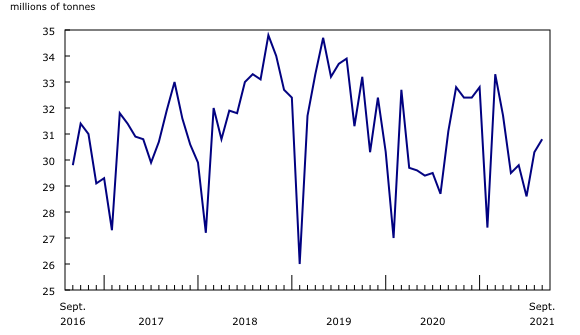
In September, the volume of cargo carried by Canadian railways reached 30.8 million tonnes, down slightly (-0.9%) from September 2020.
While the overall freight volume was very close to the five-year monthly average of 31.5 million tonnes, increases in loadings of energy products and freight traffic from US connections helped to offset lower shipments of some agricultural and food products.
To further explore current and historical data in an interactive format, please visit the Monthly Railway Carloadings: Interactive Dashboard.
Cumulative freight lags behind pre-pandemic levels
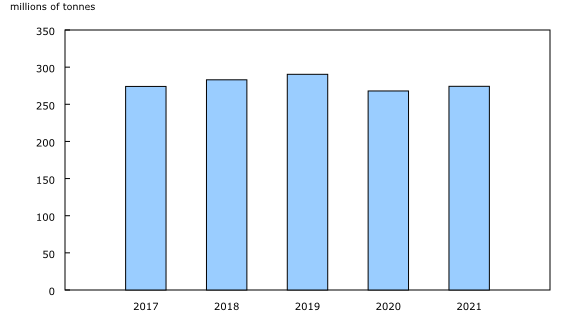
In the nine-month period from January to September, the volume of cargo moved by rail totalled 274.2 million tonnes, up 2.3% from the same period a year earlier, but 5.6% below the pre-pandemic level in September 2019.
Agricultural and food products decline
September's slight decline in total rail freight reflected a lower volume of domestic loadings, both non-intermodal and intermodal (or containers).
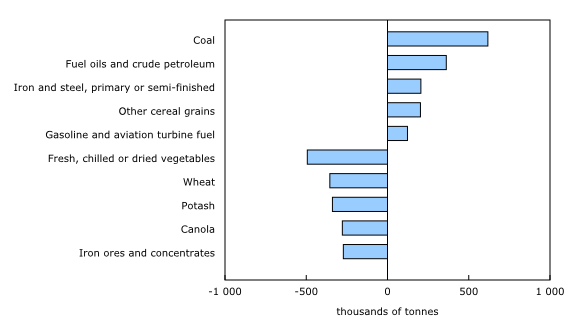
Following a 2.0% increase in August, non-intermodal loadings were down 2.5% year over year to 24.1 million tonnes in September—driven mainly by ongoing declines in loadings of some agricultural and food products. Loadings of fresh, chilled or dried vegetables dropped 49.7% (-493 000 tonnes) in September, the seventh year-over-year decline and the largest drop in four years.
Similarly, wheat loadings decreased 18.6% (-355 000 tonnes) in September compared with the same month in 2020, the fifth consecutive decline. Loadings of canola, decreasing since March, fell 21.5% (-278 000 tonnes) from the same month a year earlier. This decrease came on the heels of steep year-over-year declines in both August (-83.9%) and July (-58.1%).
Grain shipments by rail have been declining for at least the last six months, initially because of the ongoing depletion of stocks, with strong global demand for grains beginning in 2020, and, more recently, because of poor weather conditions leading to lower crop production in the Prairies.
In addition, loadings of potash decreased 16.9% (-339 000 tonnes) in September, while those of iron ores and concentrates were down 5.9% (-272 000 tonnes) from September 2020 levels.
Energy products continue to surge
Large increases in some energy products continued as the global economy reopened, spawning a rise in fuel consumption and industrial production. For instance, loadings of coal rose year over year for a second month, up 22.1% (+618 000 tonnes), following a large increase in August (+32.9%). This reflects strong global demand for industrial energy in Asia.
Similarly, loadings of fuel oils and crude petroleum grew 43.9% (+362 000 tonnes) from September 2020, their fifth straight month of year-over-year increases. Loadings of gasoline and aviation turbine fuel rose for the sixth month in a row, up 117.4% (+123 000 tonnes), following a substantial year-over-year increase in August (+106.5%).
With COVID-19 vaccines being rolled out and travel restrictions easing, more people are travelling. In September, for example, Canada's major airlines consumed the most jet fuel since March 2020. The global demand for fuels has been rising and, according to data on Canadian international merchandise trade, exports of energy products surged 101.7% year over year in September.
Loadings of iron and steel, primary or semi-finished, have posted year-over-year increases for eight straight months. They surged 73.9% (+205 000 tonnes) in September after a large gain in August (+111.6%). Statistics Canada's Monthly Survey of Manufacturing reported a strong year-over-year increase of 37.9% for primary metal manufacturing sales in September.
Domestic intermodal shipments stumble
In September 2021, intermodal shipments—mainly containers—originating in Canada declined for the first time after 11 straight months of growth. They were down 5.2% to 3.1 million tonnes from the same month a year earlier.
This decrease partly reflects ongoing supply chain bottlenecks, including the shortage of containers and congestion at major ports, which are continuing to disrupt the shipping industry. In fact, the Canadian international merchandise trade data show that Canada's imports of consumer goods recorded a year-over-year decline for a third straight month in September.
Looking ahead, the decline in intermodal traffic may continue, with the imbalance of shipping containers, port congestion and rail disruptions caused by November flooding in British Columbia.
US freight remains a bright spot
Freight traffic from connections with US railways helped to offset the overall decline in loadings in September, rising sharply by 15.5% to 3.7 million tonnes. This marks a seventh consecutive year-over-year increase in tonnage.
Note to readers
The Monthly Railway Carloadings Survey collects data on the number of rail cars, tonnage, units and 20-feet equivalent units from railway transporters operating in Canada that provide for-hire freight services.
Cargo loadings from Armstrong, Ontario, to the Atlantic coast are classified to the eastern division (eastern Canada), while loadings from Thunder Bay, Ontario, to the Pacific coast are classified to the western division (western Canada).
Survey data are revised on a monthly basis to reflect new information.
The data in this release are not seasonally adjusted.
The Transportation Data and Information Hub provides Canadians with online access to comprehensive statistics and measures on the country's transportation sector.
Contact information
For more information, or to enquire about the concepts, methods or data quality of this release, contact us (toll-free 1-800-263-1136; 514-283-8300; infostats@statcan.gc.ca) or Media Relations (statcan.mediahotline-ligneinfomedias.statcan@statcan.gc.ca).
- Date modified:


