National balance sheet and financial flow accounts, second quarter 2021
Archived Content
Information identified as archived is provided for reference, research or recordkeeping purposes. It is not subject to the Government of Canada Web Standards and has not been altered or updated since it was archived. Please "contact us" to request a format other than those available.
Released: 2021-09-10
National net worth rises as natural resource wealth grows
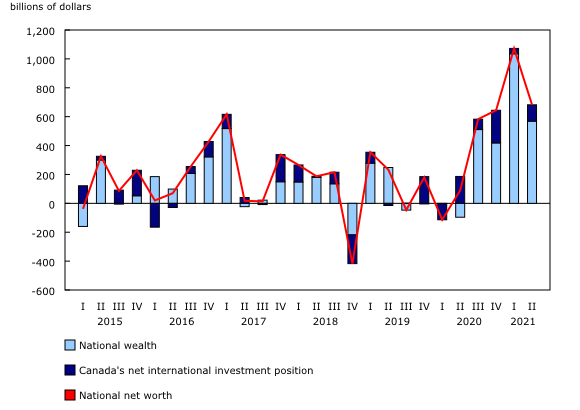
National net worth, the sum of national wealth and Canada's net foreign asset position, increased by 4.6% to reach $15,649.3 billion at the end of the second quarter. While this was a slowdown from the record-breaking growth in net worth in the first quarter (+7.7%) fuelled primarily by robust housing markets, national wealth continued to post sizable gains for a fourth consecutive quarter. On a per capita basis, national net worth rose from $392,534 to $410,149.
The total value of non-financial assets in Canada, also referred to as national wealth, rose 4.2% to $14,147.3 billion. The value of residential real estate advanced 2.7%, following a 9.4% jump in the first quarter, as prices continued to increase. Natural resource wealth rose for a fourth consecutive quarter, up $265.0 billion to $1,402.5 billion as energy prices rose once again.
Canada's net foreign asset position continued its upward trend to reach $1,501.9 billion at the end of the second quarter, an increase of $113.2 billion from the previous quarter. Rising market prices resulted in the fifth consecutive quarterly increase in the net foreign asset position. Revaluations from fluctuations in exchange rates (-$46.6 billion) moderated the overall increase. On a geographical basis, Canada's net foreign asset position with the United States was up 23.9% to $875.3 billion, and it was down 8.2% to $626.7 billion with the rest of the world.
Highlights
During the second quarter, real growth in the Canadian economy declined despite nominal growth in gross domestic product, as higher prices and supply-chain disruptions constrained activity. On a seasonally adjusted basis, declines in exports and home ownership transfer costs led the decline. Outlays for services such as food and beverages increased, while overall household spending was relatively flat as regional stay-at-home orders were imposed and lifted throughout the quarter.
The growth in household disposable income, bolstered by growing compensation of employees and higher government transfers, outpaced the nominal increase in household spending. As a result, the household savings rate moved up, remaining in double-digit territory for a fifth consecutive quarter, with households continuing to save amid pandemic-related restrictions and economic uncertainty. Despite the sales of existing homes moderating as the quarter progressed, the pace of mortgage borrowing doubled from the previous quarter, pushing up mortgage debt by a record amount as the low interest rate environment continued and stricter mortgage underwriting rules went into effect in June. At the same time, household investment in residential real estate hit record highs as new additions to the housing stock continued to climb.
Household accumulation of currency and deposits picked up the pace again after slowing considerably in the first quarter, while the investment holdings of households benefited from the persistent strength of domestic and international financial markets. The rising value of household financial assets and residential real estate contributed to an increase in household net worth of over half a trillion dollars in the quarter. Both the federal government and other levels of government continued to borrow through the issuance of bonds rather than short-term debt. Private non-financial corporations increased their demand for funds, primarily borrowing through non-mortgage loans and issuing bonds. Meanwhile, the financial sector raised its supply of funds, lending a record amount of mortgages and purchasing the majority of government bond issuances.
Household savings rate rises again
The seasonally adjusted household savings rate rose to 14.2% in the second quarter from 13.0% a quarter prior and has remained at double-digit levels since the second quarter of 2020. An increase in household disposable income, which rose at a faster pace than household consumption, resulted in greater net savings among households. While a portion of these savings was directed towards record levels of investment in new homes and renovations, the sizable remainder placed households in a net lending position as their transactions in financial assets exceeded those in liabilities (i.e., borrowing), contributing to financial wealth overall.
Households continue to invest in mutual funds at significant pace and build up additional cash reserves
Households added $40.3 billion in currency and deposits in the second quarter after a marked deceleration in the first quarter. Over the previous year and a half, households accumulated over one-quarter trillion dollars in currency and deposits, which represents approximately one-fifth of household consumption in 2020. Households registered another strong quarter of mutual fund share growth, with net purchases in the quarter of $28.3 billion. For three consecutive quarters, purchases of mutual fund shares and exchange-traded funds have been higher than at any point prior to the pandemic. This likely occurred because Canadians looked to put their savings into higher-yielding investments, as they potentially waited to direct some of this accumulated wealth towards future expenditures on goods and services. According to the second-quarter Canadian Survey of Consumer Expectations, households expected to increase their expenditures by over 4% over the next 12 months, but the eventual outcome will likely depend highly on evolving sentiments, given trends in caseloads from the ongoing pandemic.
Persistent streak of strong gains among household assets
Household-sector net worth—the value of all assets less liabilities—increased $513.4 billion to $14,230.8 billion in the second quarter. Since the first quarter of 2020, households have added almost $3 trillion to their net worth as each of the last five quarters has recorded sizable gains in total assets. Canadians have seen the value of their homes and investments rise considerably during the pandemic.
The recent 2020 release of the distributions of household economic accounts reported that the wealthiest households (top 20%) held more than two-thirds (67.5%) of all net worth in Canada, while those in the lowest two wealth quintiles—which account for 40% of all households—held 2.5% of all net worth as of the fourth quarter of 2020.
The value of financial assets rose $380.1 billion (+4.6%), a strengthening after more moderate first-quarter growth. Equity markets continued to post significant gains in the second quarter; the Toronto Stock Exchange Composite Index was up 7.8% in the quarter, while international markets, including the Standard and Poor's 500 (+8.2%), followed suit with similar strength. Although households do not hold large amounts of foreign equity directly, they possess significant holdings indirectly through mutual and pension funds. The value of these mutual fund shares, along with that of other investment holdings, rose in tandem with markets.
Counteracting some of the gains in financial assets, liabilities increased by a notable $72.4 billion, primarily mortgage debt.
Residential real estate eases as sales volumes remain elevated
The housing market remained robust in the second quarter, which is typically a stronger quarter for real estate activity, as the value of residential real estate owned by households increased 2.6%. Sales activity did not surpass seasonal expectations to the same extent as in the first quarter, a traditionally slower time in the Canadian real estate market. Although the national average sale price of existing homes has fallen from its March peak, the average selling price edged up in the second quarter, while year-over-year gains in new home prices remained near record highs in June. The replacement cost of existing buildings and dwellings in Canada rose as material prices jumped in the quarter; the value of residential structures increased 5.7% in the quarter.
Residential real estate sales volumes have declined each month since the record high in March. Nonetheless, the second quarter was the strongest quarter of residential real estate activity on record, with the total value of sales up 23.5% from the first quarter.
Seasonally adjusted housing investment, which includes new purchases, remained very strong, rising 0.6% from the previous record quarter. Both new construction and renovations—the components of residential capital stock—have shown sustained growth since the third quarter of 2020. Investment has continued to increase for new houses (+8.6%) and home renovations (+7.1%), likely bolstered by the increased importance of housing as many Canadians continued to work from home and travel less and as low mortgage rates persisted.
Owners' equity as a percentage of real estate edged down from 76.5% to 76.3% at the end of the second quarter as the growth in outstanding mortgage debt outpaced gains in the value of real estate. This decline ends a streak of five consecutive quarters where equity made up a steadily larger share of real estate holdings. Total real estate now represents five times the level of household disposable income, rising to 501.3% from 487.4% in the first quarter.
Mortgage borrowing sets new record
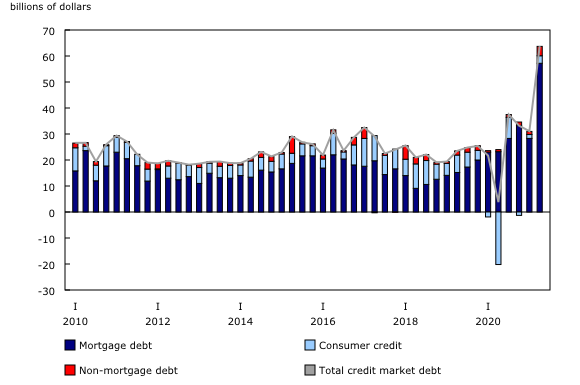
On a seasonally adjusted basis, total credit market borrowing rose sharply to $63.8 billion in the second quarter, more than double the amount of borrowing in the first quarter, and well above the previous record set in the third quarter of 2020 (+$37.5 billion). Demand for mortgage loans was $57.2 billion, driving the overall increase and eclipsing the previous record for mortgage borrowing in the fourth quarter of 2020, as mortgage rules were tightened in June and rates remained low compared with historical levels. Demand for non-mortgage loans by households was $6.6 billion, also double the previous quarter. Overall, mortgage borrowing made up 89.7% of the net additions to credit market debt.
Chartered banks provided $48.7 billion of residential mortgage funds to households in the quarter, while the next largest provider, quasi-banks, provided $9.5 billion. Quasi-banks are composed of credit unions and trust and mortgage loan companies. While they historically represent a smaller share of mortgage lending to households, they recorded record activity in the second quarter, similar to chartered banks. Among new mortgage funds advanced by chartered banks, increasing demand was notable for variable-rate uninsured residential mortgages.
The high borrowing activity pushed the stock of credit market debt (consumer credit, and mortgage and non-mortgage loans) past $2.5 trillion by the end of the quarter, to $2,533.4 billion. Mortgage debt was $1,741.7 billion, while non-mortgage loans stood at $797.7 billion. Since the first quarter of 2020, the stock of outstanding non-mortgage loan debt has decreased 0.8%, while the stock of outstanding mortgage debt has grown 10.8%.
Household debt-to-income and debt service ratios remain below pre-pandemic levels
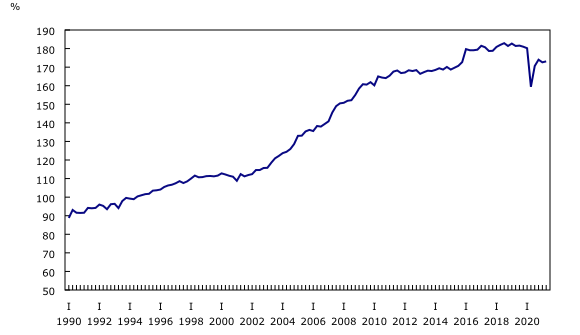
On a seasonally adjusted basis, household credit market debt as a proportion of household disposable income rose from 172.6% in the first quarter to 173.1%, as the 2.5% increase in household credit market debt and vigorous mortgage borrowing outweighed the growth in household disposable income (+2.2%). In other words, there was $1.73 in credit market debt for every dollar of household disposable income.
Despite the rising share of debt to disposable income, the household debt service ratio, measured as total obligated payments of principal and interest on credit market debt as a proportion of household disposable income, decreased from 13.45% in the first quarter to 13.32% in the second quarter. Growth in household disposable income before interest payments (+2.1%) outpaced that of total debt payments (+1.1%). Despite the continued robust mortgage borrowing, interest payments on mortgage debt edged down, while obligated payments of principal grew for the fourth quarter in a row.
Federal government bond borrowing continues
The federal government demand for credit market debt was $52.9 billion in the second quarter. This demand was comprised almost entirely of $53.0 billion in net issuances of federal government bonds, as demand for other credit market instruments tapered off. The Bank of Canada accounted for the majority of federal bond net purchases (+$43.7 billion), while non-residents recorded net purchases of $14.4 billion. This was the fifth consecutive quarter of net bond issuances in the double-digit billion-dollar range, with the federal government's net issuances of bonds totalling $336.4 billion over the past five quarters.
For other levels of government (excluding social security funds), demand for credit market funds totalled $21.1 billion in the second quarter. This demand was largely made up of provincial and territorial governments' net issuances of bonds, which fell to $19.2 billion from $25.7 billion in the previous quarter.
Ratios of government debt to gross domestic product moderate
The ratio of federal government net debt (the book value of total financial liabilities less total financial assets) to gross domestic product (GDP) edged down to 38.0% in the second quarter, while the ratio of other government net debt to GDP fell to 26.7% from 28.0%.
Private non-financial corporations' demand for funds rises
The demand for funds by private non-financial corporations was $31.4 billion in the quarter, the second-highest demand from this group since the beginning of the pandemic. Demand was mainly in the form of non-mortgage loan borrowing (+$16.4 billion) and bond issuances (+$11.0 billion). This was offset by a decrease in listed shares (-$2.9 billion) and net retirement of short-term paper ($0.3 billion). Over the last four quarters, non-financial corporations' net lending has been greater than any four-quarter stretch since 1990 (+$95.8 billion), as government subsidies and commodity prices bolstered operating surpluses, while expenditures on gross fixed capital formation weakened.
Total currency and deposits of private non-financial corporations rose 7.2% to $762.6 billion. According to the August edition of the Canadian Survey on Business Conditions, 79.3% of businesses reported having the cash or liquid assets required to operate over the next three months, up from approximately 75% reported in May. Meanwhile, approximately 19% of businesses reported they cannot incur additional debt, an increase from the 14.8% reported in the May 2021 release.
Chartered banks were the primary provider of non-mortgage loans to private non-financial corporations in the quarter, while government programs, such as the Canada Emergency Business Account (which stopped accepting applications at the end of June), continued to financially support private non-financial corporations through non-mortgage loans (+$3.7 billion).
Financial sector supply of funds increases as mortgage lending hits record level
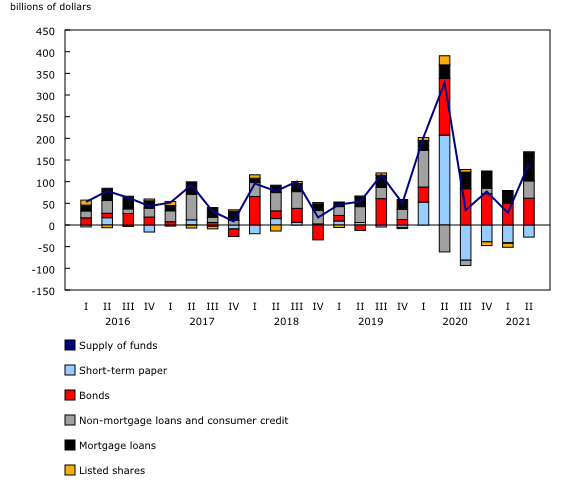
Financial corporations provided $141.0 billion in funds to the economy through financial market instruments, an increase from $28.2 billion in the previous quarter. The supply of funds mainly came from $65.8 billion in mortgage loans and $61.9 billion in net bond purchases, principally provided by chartered banks and the Bank of Canada, respectively. It was partially offset by the net retirement of short-term paper ($27.9 billion).
The market value of financial corporation financial assets was up 3.1% to $19,125.2 billion. The growth was primarily the result of a $550.5 billion increase in the value of equity and investment fund shares, as both domestic and foreign equity markets performed well. This increase was partly offset by a decrease in the value of currency and deposits, which fell by $87.1 billion as a term lending program with the central bank wound down. The market value of financial assets of mutual funds, whose wealth is predominantly held by households, grew 6.8% to reach $3,042.1 billion, fuelled by net transactions in foreign equity, as well as upward revaluations in equity and investment fund shares.
Note to readers
Revisions
This release of the national balance sheet and financial flow accounts for the second quarter of 2021 includes revised estimates from the first quarter of 2021. These data incorporate new and revised data, as well as updated data on seasonal trends. An overview of these conceptual, methodological and statistical revisions is available in "An overview of revisions to the Financial and Wealth Accounts, 1990 to 2020."
Data enhancements to the national balance sheet and financial flow accounts, such as the development of detailed counterparty information by sector, will be incorporated on an ongoing basis. To facilitate this initiative and others, it is necessary to extend the annual revision period (normally the previous three years) at the time of the third-quarter release. Consequently, for the next two years, with the third-quarter release of the financial and wealth accounts, data will be revised back to 1990 to ensure a continuous time series.
With the third-quarter release of 2021, various changes will be incorporated into the national balance sheet and financial flow accounts. These include a redesigned presentation for non-financial assets to provide more granularity and better align with international standards. Additionally, estimates for derivatives will be investigated in preparation for their publication as a separate financial instrument, and repurchase agreements will be reclassified as loans rather than other payables and receivables. In conjunction with the third-quarter release, an article highlighting these revisions in greater detail will be released.
Financial and wealth accounts on a from-whom-to-whom basis: Selected financial instruments
The data visualization product "Financial accounts on a from-whom-to-whom basis, selected financial instruments" has been updated with data from the first quarter to the second quarter of 2021.
Next release
Data on the national balance sheet and financial flow accounts for the third quarter will be released on December 10.
Overview of the Financial and Wealth Accounts
This release of the Financial and Wealth Accounts comprises the National Balance Sheet Accounts (NBSA), the Financial Flow Accounts (FFA), and the other changes in assets account.
The NBSA are composed of the balance sheets of all sectors and subsectors of the economy. The main sectors are households, non-profit institutions serving households, financial corporations, non-financial corporations, government and non-residents. The NBSA cover all national non-financial assets and all financial asset-liability claims outstanding in all sectors. To improve the interpretability of financial flows data, selected household borrowing series are available on a seasonally adjusted basis (table 38-10-0238-01). All other data are unadjusted for seasonal variation. For information on seasonal adjustment, see Seasonally adjusted data – Frequently asked questions.
The FFA articulate net lending or borrowing activity by sector by measuring financial transactions in the economy. The FFA arrive at a measure of net financial investment, which is the difference between transactions in financial assets and liabilities (for example, net purchases of securities less net issuances of securities). The FFA also provide the link between financial and non-financial activity in the economy, which ties estimates of saving and non-financial capital acquisition (for example, investment in new housing) to the underlying financial transactions.
While the FFA record changes in financial assets and liabilities between opening and closing balance sheets that are associated with transactions during the accounting period, the value of assets and liabilities held by an institution can also change for other reasons. These other types of changes, referred to as other economic flows, are recorded in the other changes in assets account.
There are two main components to this account. One is the other changes in the volume of assets account. This account includes changes in non-financial and financial assets and liabilities relating to the economic appearance and disappearance of assets, the effects of external events such as wars or catastrophes on the value of assets, and changes in the classification and structure of assets. The other main component is the revaluation account, showing holding gains or losses accruing to the owners of non-financial and financial assets and liabilities during the accounting period as a result of changes in market price valuations.
At present, only the aggregate other change in assets is available within the Canadian System of Macroeconomic Accounts; no details are available on the different components.
Definitions concerning financial indicators can be found in Financial indicators from the National Balance Sheet Accounts and in the Canadian System of Macroeconomic Accounts glossary.
Distributions of household economic accounts
The NBSA for the household sector is allocated across a number of socioeconomic dimensions as part of the distributions of household economic accounts (DHEA). Data on wealth and its components by income quintile, age, generation and region are available in tables 36-10-0585-01, 36-10-0586-01, 36-10-0589-01 and 36-10-0590-01.
The methodology for DHEA wealth estimates can be found in the article "Distributions of Household Economic Accounts, estimates of asset, liability and net worth distributions, 2010 to 2019: Technical methodology and quality report."
Products
The data visualization product "Financial accounts on a from-whom-to-whom basis, selected financial instruments," which is part of Statistics Canada – Data Visualization Products (71-607-X), is now available.
The data visualization product "Distributions of Household Economic Accounts, Wealth: Interactive tool," which is part of Statistics Canada – Data Visualization Products (71-607-X), is available.
The data visualization product "Securities statistics," which is part of the series Statistics Canada – Data Visualization Products (71-607-X), is available.
The Economic accounts statistics portal, accessible from the Subjects module of our website, features an up-to-date portrait of national and provincial economies and their structure.
The Latest Developments in the Canadian Economic Accounts (13-605-X) is available.
The User Guide: Canadian System of Macroeconomic Accounts (13-606-G) is available.
The Methodological Guide: Canadian System of Macroeconomic Accounts (13-607-X) is available.
Contact information
For more information, or to enquire about the concepts, methods or data quality of this release, contact us (toll-free 1-800-263-1136; 514-283-8300; STATCAN.infostats-infostats.STATCAN@canada.ca) or Media Relations (613-951-4636; STATCAN.mediahotline-ligneinfomedias.STATCAN@canada.ca).
- Date modified:


