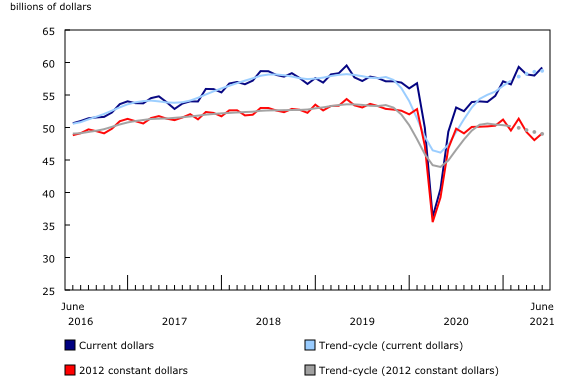
Chart 1
Manufacturing sales

Note(s):
Data are seasonally adjusted. The higher variability associated with the trend-cycle estimates is indicated with a dotted line on the chart for the current reference month and the three previous months. For more information, see the note to readers.
Source(s):
Tables 16-10-0047-01 and 16-10-0013-01.
Chart description
This is a line chart.
| Current dollars | Trend-cycle (current dollars) | 2012 constant dollars | Trend-cycle (2012 constant dollars) | |
|---|---|---|---|---|
| June 2016 | 50.658 | 50.582 | 48.812 | 49.064 |
| July 2016 | 51.000 | 50.823 | 49.120 | 49.118 |
| August 2016 | 51.419 | 51.252 | 49.712 | 49.315 |
| September 2016 | 51.547 | 51.655 | 49.436 | 49.499 |
| October 2016 | 51.635 | 52.084 | 49.102 | 49.742 |
| November 2016 | 52.314 | 52.587 | 49.815 | 50.101 |
| December 2016 | 53.591 | 53.102 | 50.964 | 50.471 |
| January 2017 | 54.026 | 53.569 | 51.330 | 50.781 |
| February 2017 | 53.746 | 53.877 | 50.973 | 50.995 |
| March 2017 | 53.714 | 54.060 | 50.617 | 51.155 |
| April 2017 | 54.521 | 54.140 | 51.458 | 51.309 |
| May 2017 | 54.797 | 54.019 | 51.754 | 51.358 |
| June 2017 | 53.881 | 53.855 | 51.358 | 51.389 |
| July 2017 | 52.857 | 53.808 | 51.131 | 51.485 |
| August 2017 | 53.675 | 53.883 | 51.538 | 51.576 |
| September 2017 | 54.021 | 54.143 | 52.053 | 51.695 |
| October 2017 | 54.004 | 54.570 | 51.253 | 51.823 |
| November 2017 | 55.934 | 55.080 | 52.384 | 51.978 |
| December 2017 | 55.903 | 55.567 | 52.240 | 52.084 |
| January 2018 | 55.399 | 56.015 | 51.721 | 52.177 |
| February 2018 | 56.765 | 56.422 | 52.640 | 52.246 |
| March 2018 | 57.001 | 56.830 | 52.646 | 52.312 |
| April 2018 | 56.652 | 57.207 | 51.860 | 52.374 |
| May 2018 | 57.210 | 57.565 | 51.964 | 52.427 |
| June 2018 | 58.673 | 57.961 | 53.004 | 52.569 |
| July 2018 | 58.660 | 58.148 | 53.001 | 52.624 |
| August 2018 | 58.085 | 58.161 | 52.619 | 52.649 |
| September 2018 | 57.823 | 58.040 | 52.358 | 52.668 |
| October 2018 | 58.360 | 57.843 | 52.863 | 52.694 |
| November 2018 | 57.606 | 57.587 | 52.727 | 52.704 |
| December 2018 | 56.699 | 57.446 | 52.260 | 52.766 |
| January 2019 | 57.594 | 57.525 | 53.515 | 52.946 |
| February 2019 | 56.908 | 57.671 | 52.626 | 53.098 |
| March 2019 | 58.172 | 57.923 | 53.312 | 53.300 |
| April 2019 | 58.351 | 58.103 | 53.346 | 53.444 |
| May 2019 | 59.540 | 58.205 | 54.381 | 53.567 |
| June 2019 | 57.709 | 58.086 | 53.406 | 53.554 |
| July 2019 | 57.155 | 57.898 | 53.081 | 53.477 |
| August 2019 | 57.828 | 57.659 | 53.636 | 53.344 |
| September 2019 | 57.591 | 57.584 | 53.297 | 53.298 |
| October 2019 | 57.106 | 57.772 | 52.866 | 53.452 |
| November 2019 | 57.107 | 57.319 | 52.755 | 53.056 |
| December 2019 | 56.910 | 56.054 | 52.581 | 51.992 |
| January 2020 | 56.020 | 54.057 | 52.022 | 50.363 |
| February 2020 | 56.812 | 51.403 | 52.830 | 48.208 |
| March 2020 | 49.953 | 48.570 | 47.160 | 45.902 |
| April 2020 | 36.209 | 46.489 | 35.444 | 44.204 |
| May 2020 | 40.564 | 46.141 | 39.236 | 43.933 |
| June 2020 | 49.346 | 47.331 | 46.780 | 44.933 |
| July 2020 | 53.078 | 49.317 | 49.819 | 46.573 |
| August 2020 | 52.511 | 51.276 | 49.097 | 48.153 |
| September 2020 | 53.912 | 53.066 | 50.088 | 49.523 |
| October 2020 | 54.016 | 54.397 | 50.118 | 50.424 |
| November 2020 | 53.934 | 55.032 | 50.171 | 50.607 |
| December 2020 | 54.863 | 55.522 | 50.279 | 50.451 |
| January 2021 | 57.105 | 56.404 | 51.224 | 50.359 |
| February 2021 | 56.633 | 57.217 | 49.538 | 50.199 |
| March 2021 | 59.325 | 57.835 | 51.357 | 49.949 |
| April 2021 | 58.175 | 58.265 | 49.304 | 49.610 |
| May 2021 | 57.993 | 58.570 | 48.058 | 49.312 |
| June 2021 | 59.234 | 58.713 | 49.100 | 49.018 |
Note(s):
Data are seasonally adjusted. The higher variability associated with the trend-cycle estimates is indicated with a dotted line on the chart for the current reference month and the three previous months. For more information, see the note to readers.
Source(s):
Tables 16-10-0047-01 and 16-10-0013-01.
- Date modified: